Control Mixer panel

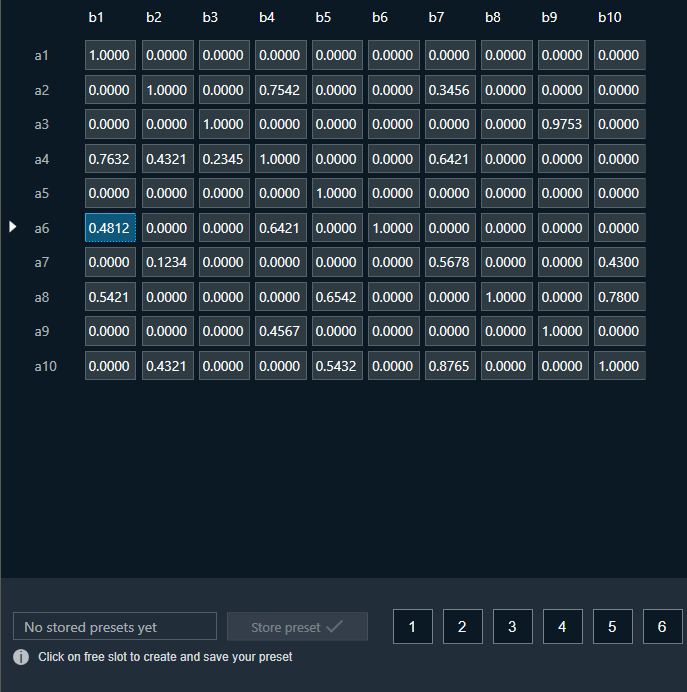
The Control Mixer object supports native panel. The native panel window consists of rows and column. The number of row and column depends on “number of control inputs and outputs” configured. 

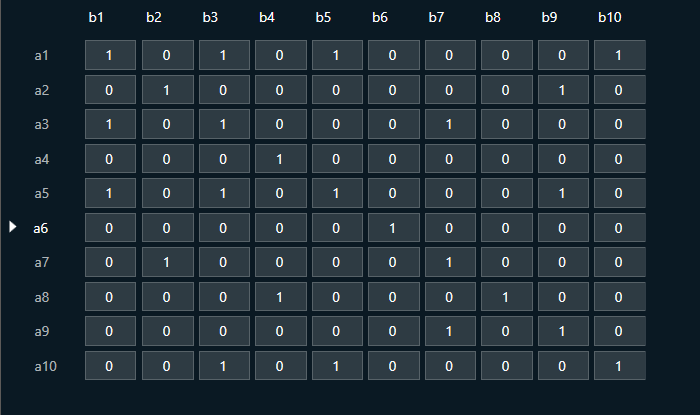
In Non Weight Mode, table cells can have only two values 0 or 1.

In Weight Mode, table cells can have values from 0 to 1.

Control Mixer supports copy-pasting values from and into Excel sheets.

You can store the specific configuration and recalled via Store Preset option available on the panel. Configure the tuning parameters and select the free preset slot numbers, enter the name of the slot, and click Store preset. This saves and stores the current tuning data to the selected slot.

If you do not enter a name of the slot, then it will take the default named “New Preset”.

You can switch between presets slots and apply their values by simply clicking on them. Additionally, after clicking to override the preset, you can modify the tuning values in that tab or change the preset name.

To reset the selected preset or all the preset values.

  • Click Reset Selected to clear the preset that is currently selected.
  • Click Reset All to clear every preset in the corresponding native panel.

Control Router panel

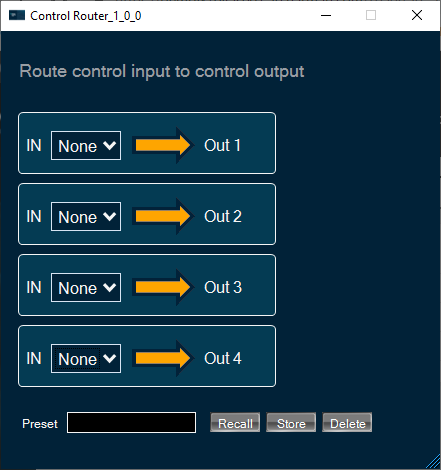
The Control Router audio object supports native panel. The native panel window is a dynamic native panel. Panel get adapted in size based on the Router AO configuration. 

By default, all outputs are disconnected.

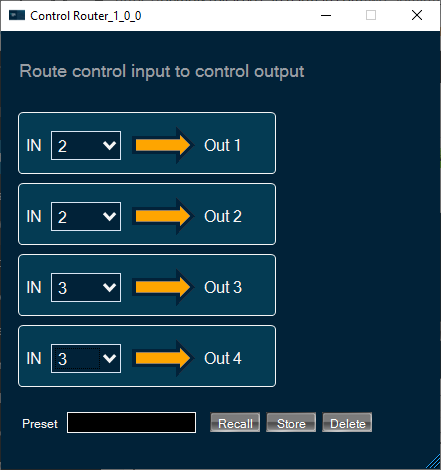
Every output has an input that can be configured. More than one output can be assigned to a single input signal.
It is possible that some input signals are not assigned to any output.

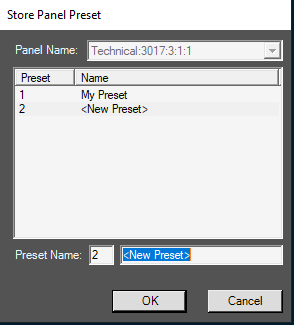
Additionally, this panel enables to store presets for specific configuration.

Name of preset is configurable in separate window after click Store button:

FastConv Panel

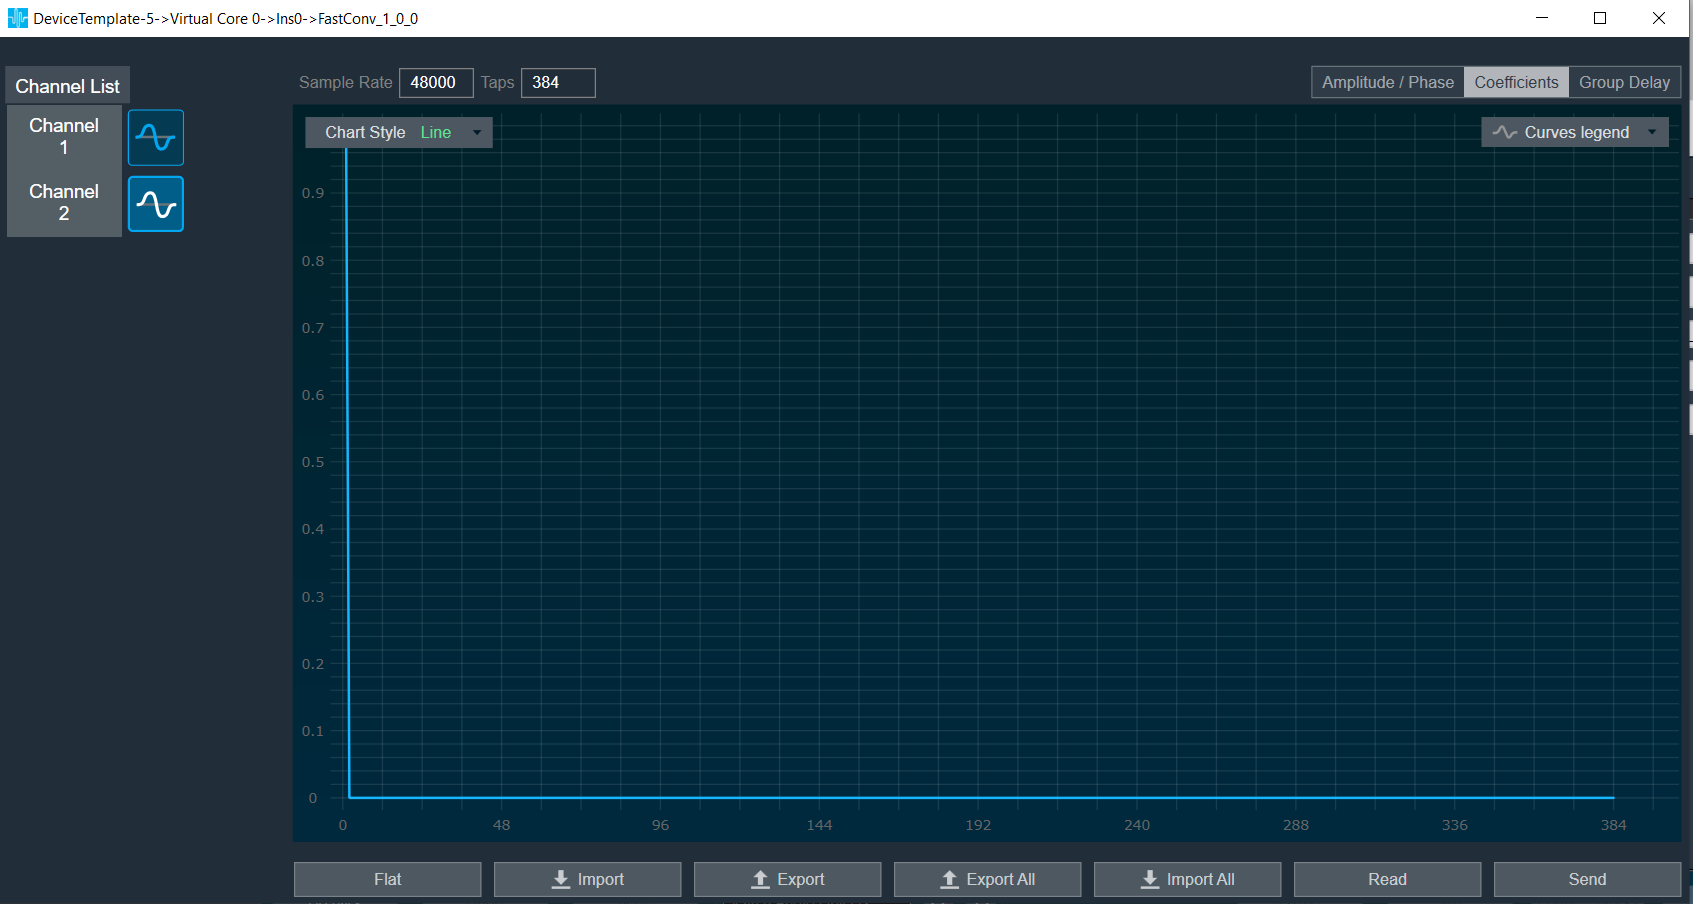
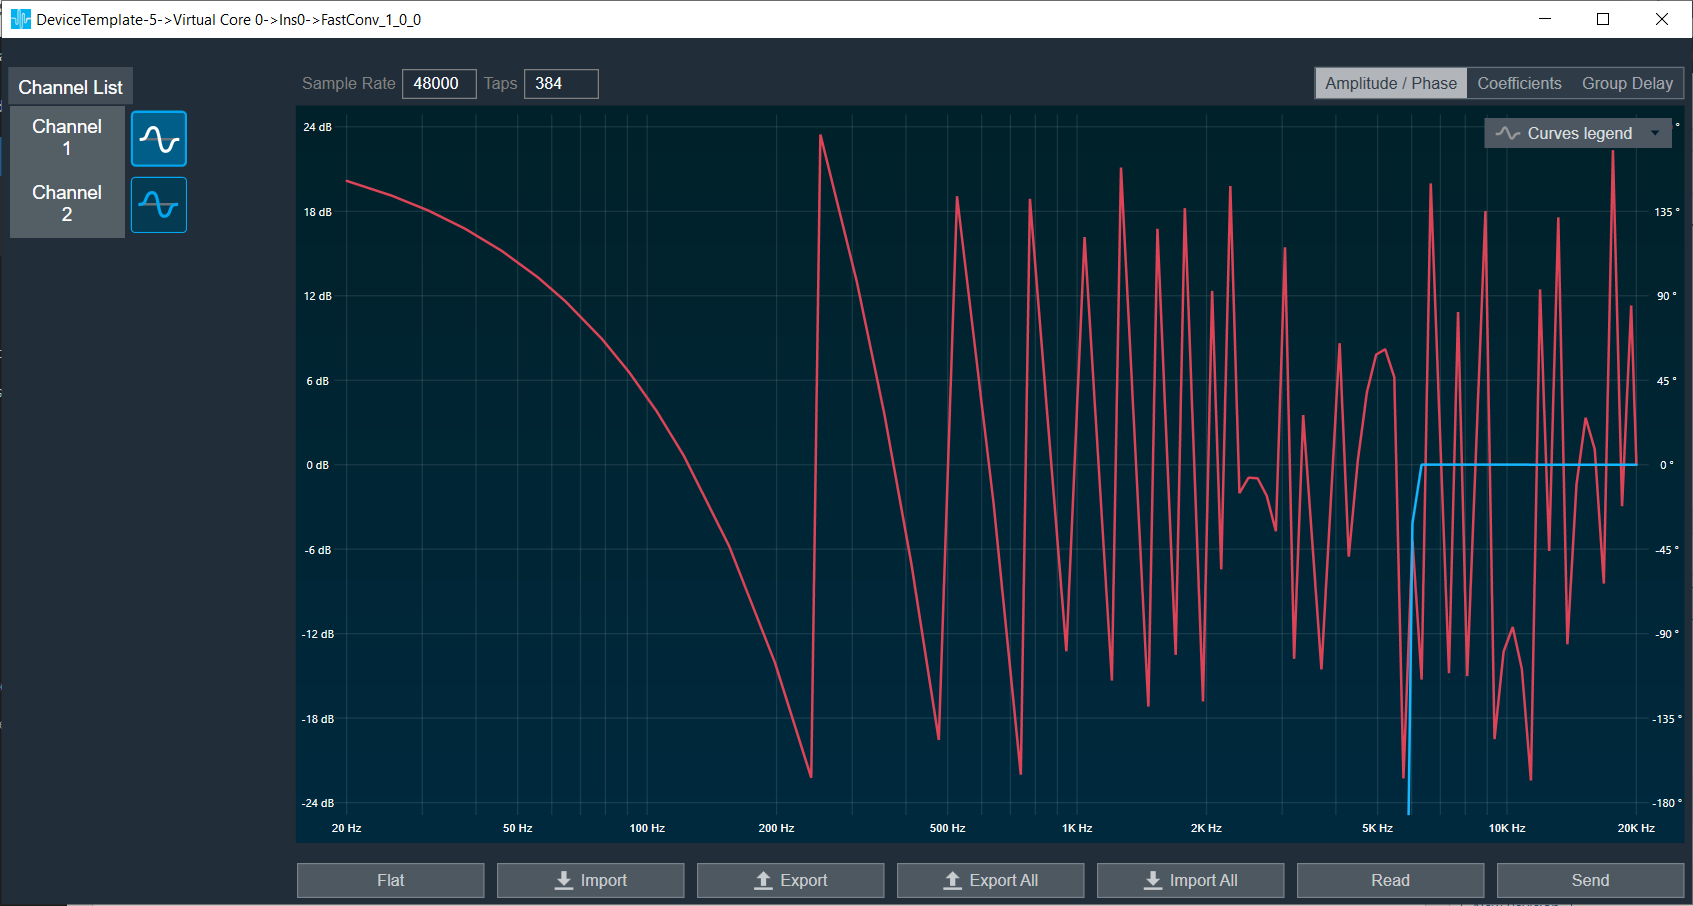
Fast Conv filter native panel allows you to configure the Mode of each enabled filter and to load coefficients as well. In order to see the graphs, you need to import coefficients. Use ‘Import’ or ‘Import All’ option  to import coefficients.
To open the native panel, double-click on the Fast Conv filter audio object in the signal flow designer.

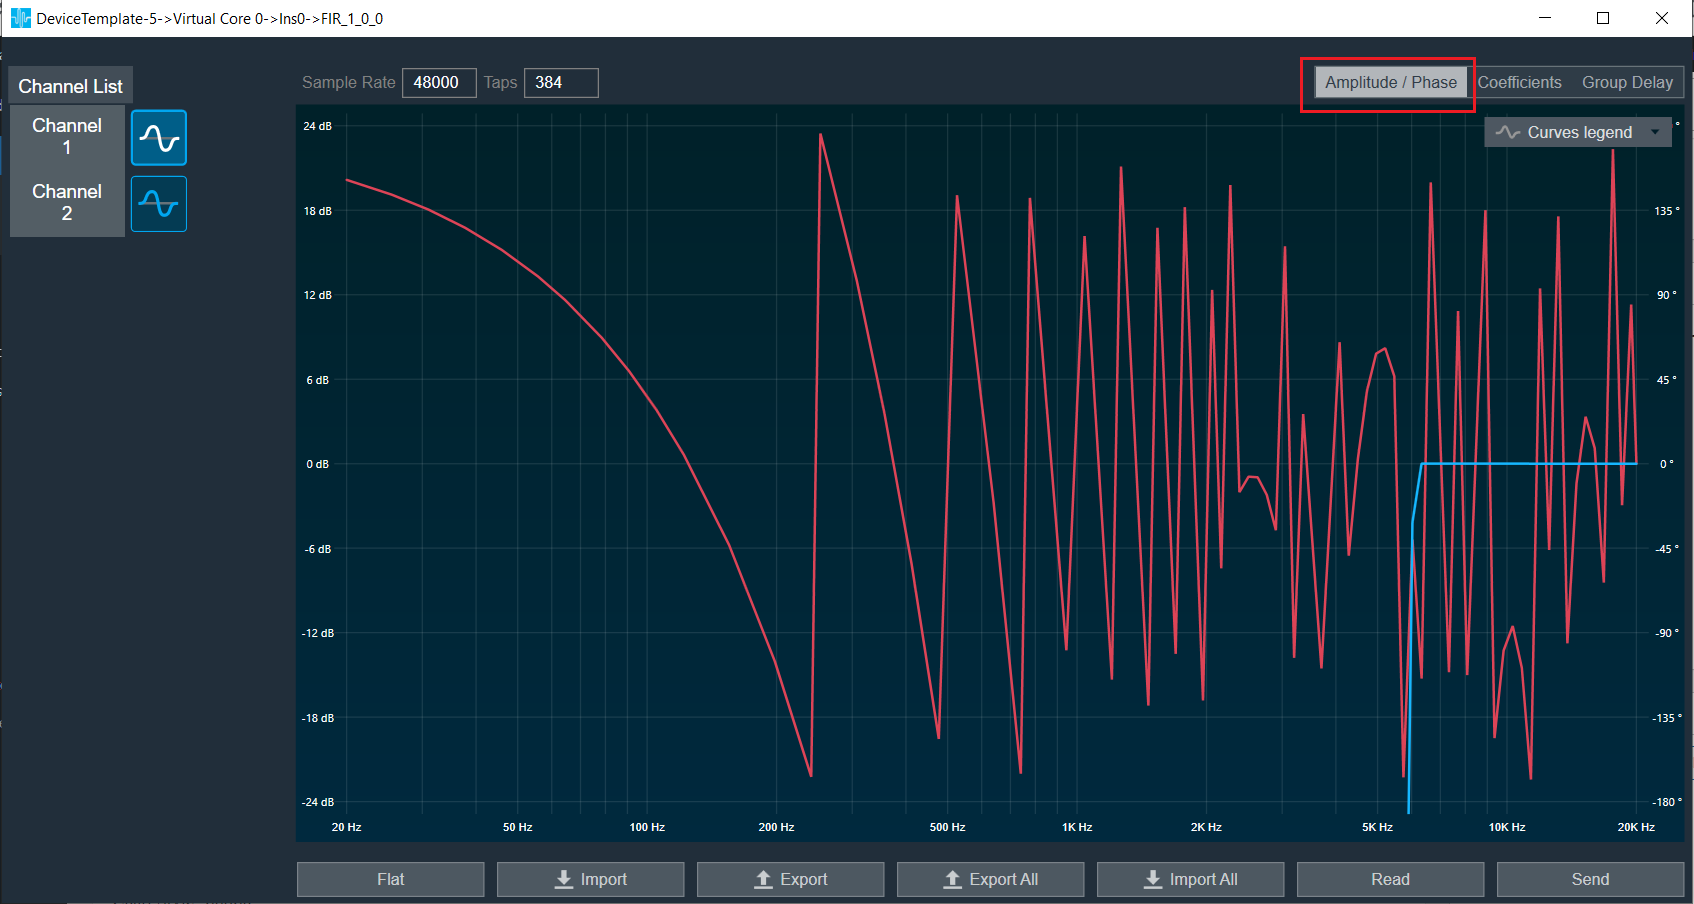
Amplitude/Phase: When the coefficients are given and “Amplitude/Phase” option is selected, the graph display the value.

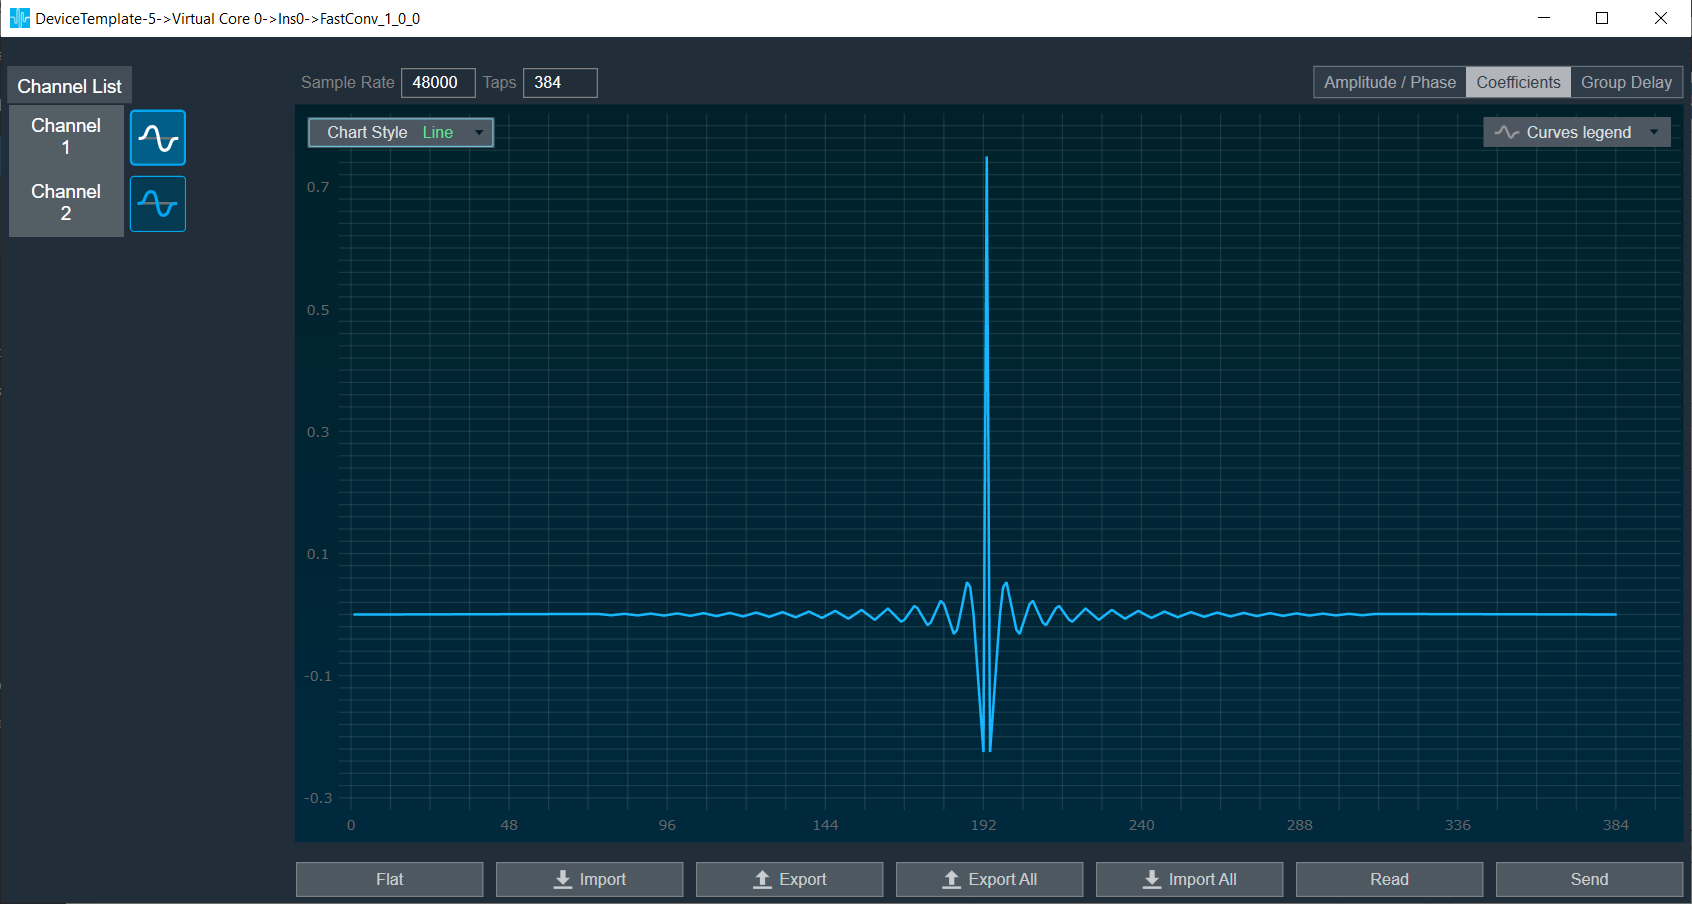
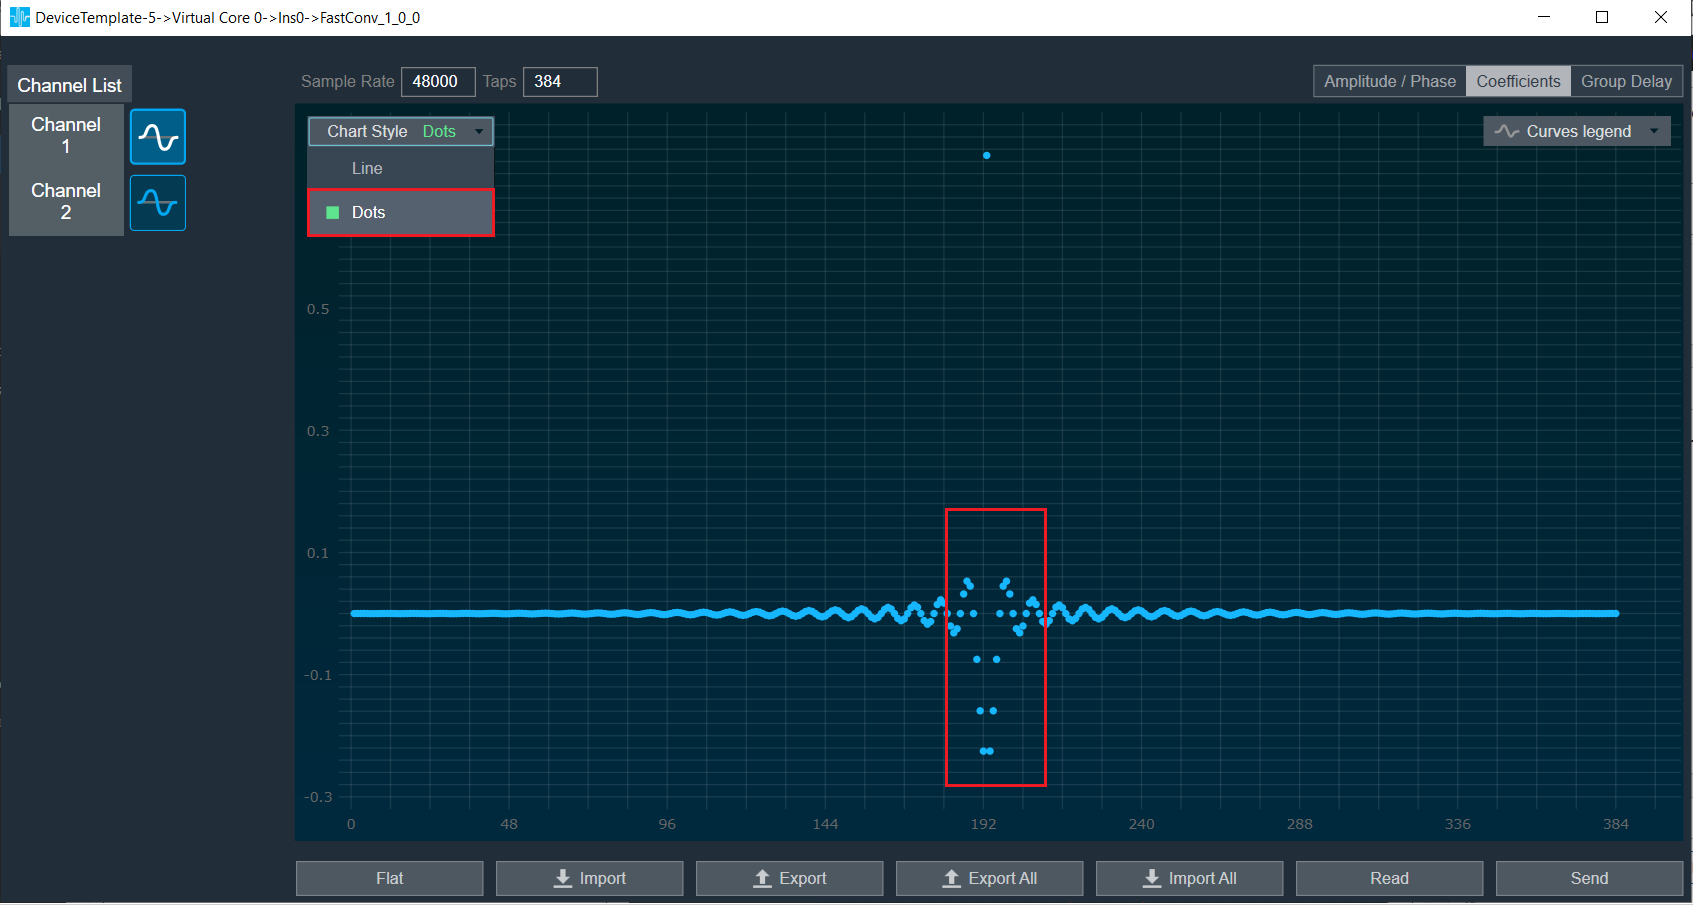
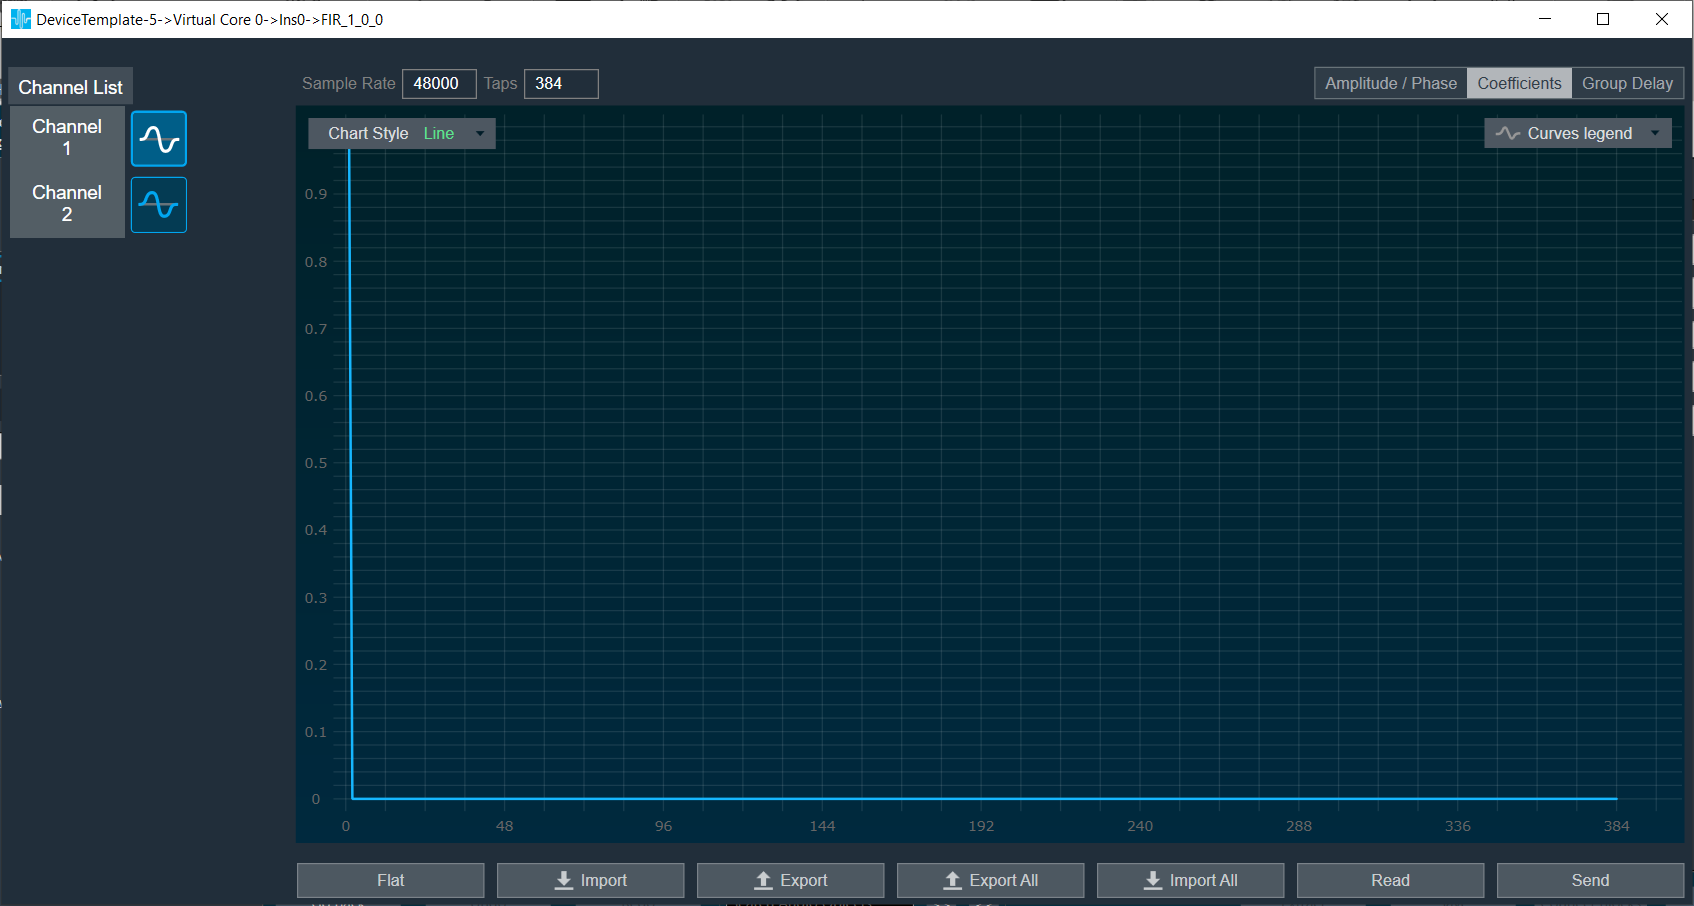
Coefficients:  When the coefficients are given and the “Coefficients” option is selected, the graph displays the values as per below figure. You can change the graph style using the “Chart Style” option.

Line chart style: when “Chart Style” selected as Line, the Coefficients graph.
Dot chart style: when “Chart Style” selected as Dot, the Coefficients graph.

Group Delay: When the coefficients are given and “Group Delay” option is selected, the graph display the values.

Curves Legend: This option allows you to show the details of which graph tab (Amplitude/Phase, Coefficients, Group Delay) is selected.

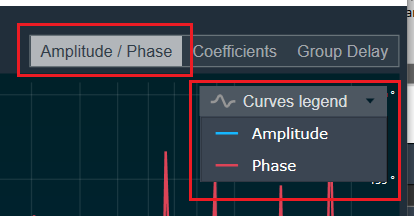
On the selection of Amplitude/Phase graph tab Curves Legend will show below information. A screenshot of a computer Description automatically generated
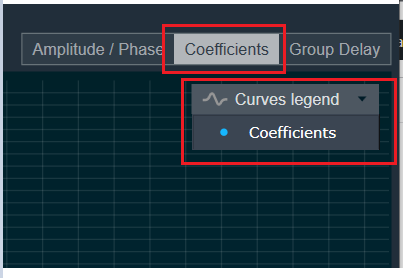
On the selection of Coefficients graph tab and Chart Styles ‘Dots’, Curves Legend will show below information. A screenshot of a computer Description automatically generated
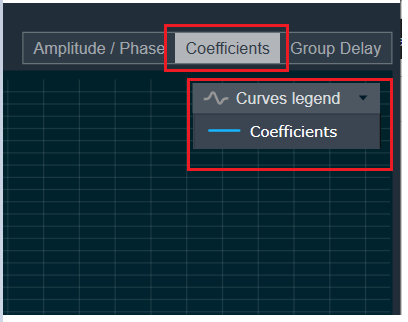
On the selection of Coefficients graph tab and Chart Styles ‘Line’, Curves Legend will show information. A screenshot of a graph Description automatically generated
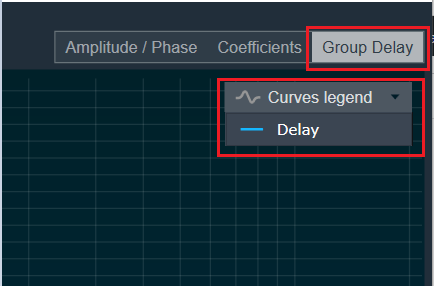
On the selection of Group Delay graph tab, Curves Legend will show information. A screenshot of a computer program Description automatically generated

Additional Functionalities

  • Flat: This is used to make the graph flat by making coefficients to 0.
  • Import: This function is used to import the coefficients for a single active filter. Click the “Import” button, then enter the file path and click Ok.
    All coefficients for the selected filter will be imported, as shown in the graph. If the number of coefficients does not match the number of taps as shown in the screenshot below, a warning pop up will appear. Click ‘Yes’ to import available coefficients or click ‘No’ to cancel the import.
  • Export: This option is used to export coefficients for selected active filter into csv file.
  • Export All: This option is used to export all active filters in one go. Click the “Export All” button, then enter the path and file name, then click Ok. A xml file will be created which will have coefficients for each active filter. 
  • Import All: This option is used to import all coefficients in one go. Click the “Import All” button, then enter the XML file path and click Ok. All the given coefficients will be imported and can be seen in the graph. 
  • Read:  This is used to read from the target to display in the panel.
  • Send: This is used to send the values changed in panel to target.

FIR Filter Panel

FIR Filter native panel allows you to configure the Mode of each enabled filter and to load coefficients as well. In order to see the graphs, you need to import coefficients. Use ‘Import’ or ‘Import All’ option  to import coefficients.

To open the native panel, double-click on the FIR Filter audio object in the signal flow designer.

Amplitude/Phase: When the coefficients are given and “Amplitude/Phase” option is selected, the graph display the value.

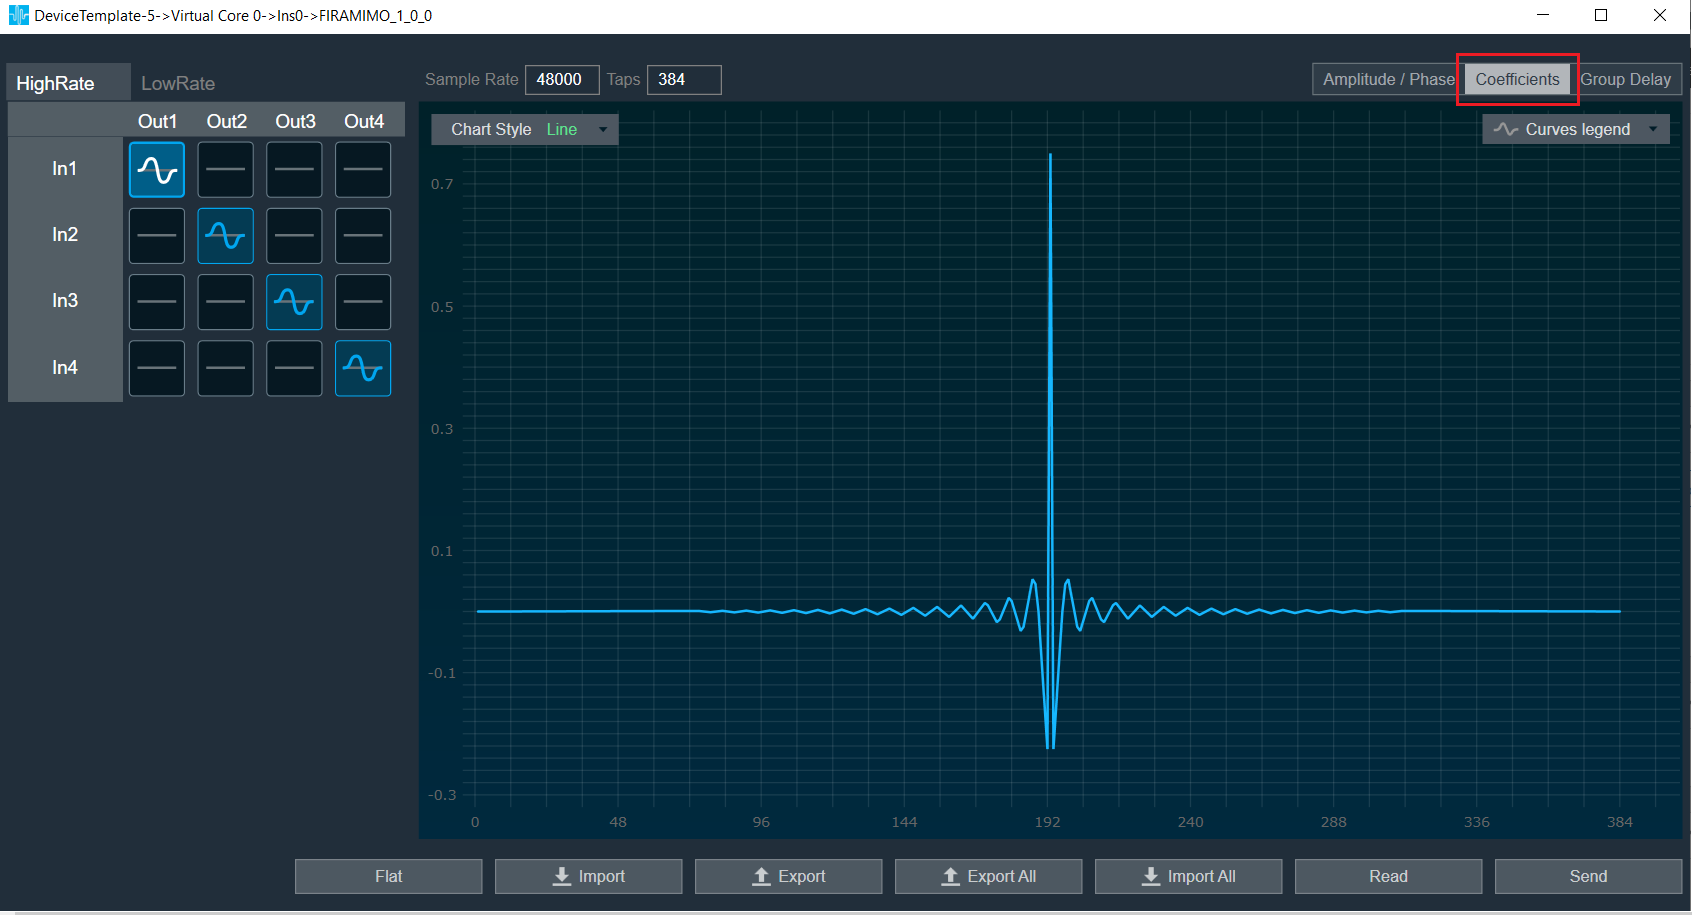
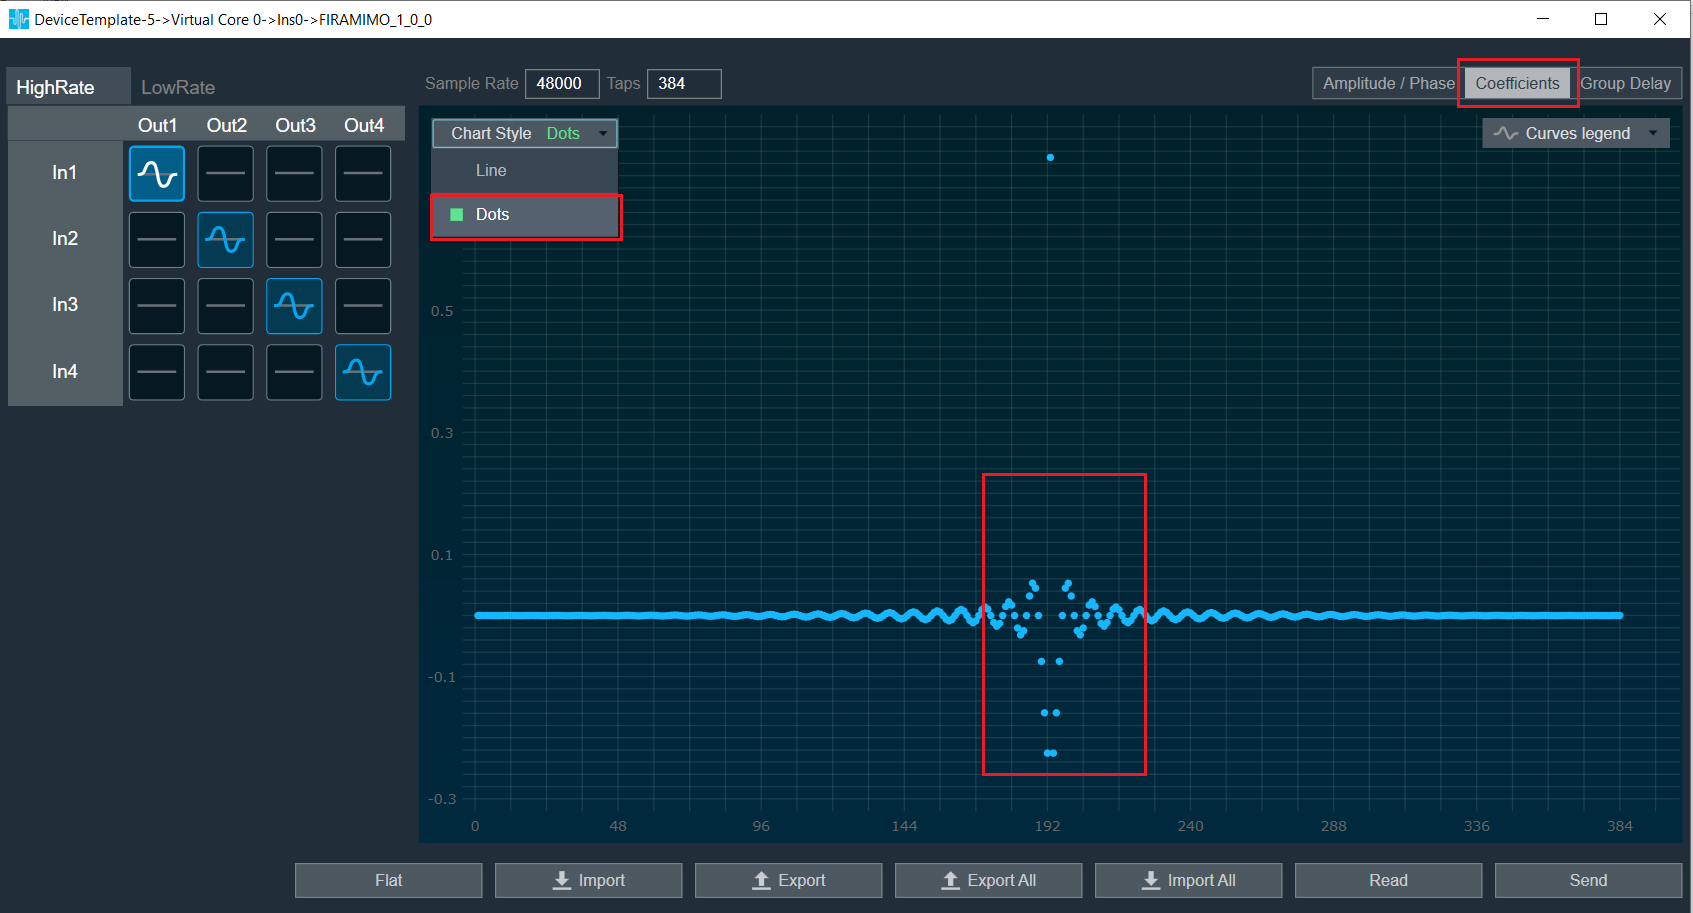
Coefficients:  When the coefficients are given and the “Coefficients” option is selected, the graph displays the values as per below figure. You can change the graph style using the “Chart Style” option.

Line chart style: when “Chart Style” selected as Line, the Coefficients graph. A screen shot of a computer Description automatically generated
Dot chart style: when “Chart Style” selected as Dot, the Coefficients graph. A screenshot of a computer Description automatically generated

Group Delay: When the coefficients are given and “Group Delay” option is selected, the graph display the values.

Curves Legend: This option allows you to show the details of which graph tab (Amplitude/Phase, Coefficients, Group Delay) is selected.

On the selection of Amplitude/Phase graph tab Curves Legend will show below information. A screenshot of a computer Description automatically generated
On the selection of Coefficients graph tab and Chart Styles ‘Dots’, Curves Legend will show below information. A screenshot of a computer Description automatically generated
On the selection of Coefficients graph tab and Chart Styles ‘Line’, Curves Legend will show information. A screenshot of a graph Description automatically generated
On the selection of Group Delay graph tab, Curves Legend will show information. A screenshot of a computer program Description automatically generated

Additional Functionalities

  • Flat : This is used to make the graph flat by making coefficients to 0.
  • Import : This function is used to import the coefficients for a single active filter. Click on the “Import” button, then enter the file path and click Ok.
    All coefficients for the selected filter will be imported, as shown in the graph. If the number of coefficients does not match the number of taps, a warning pop up will appear. Click ‘Yes’ to import available coefficients or click ‘No’ to cancel the import.
  • Export : This option is used to export coefficients for selected active filter into csv file.
  • Export All : This option is used to export all active filters in one go. Click on the “Export All” button, enter the path and file name, then click Ok. A xml file will be created which have coefficients for each active filter. 
  • Import All: This option is used to import all coefficients in one go. Click on the “Import All” button, enter the XML file path and then click Ok. All the given coefficients will be imported and can be seen in the graph. 
  • Read:  This is used to read from the target to display in the panel.
  • Send : This is used to send the values changed in panel to target.

Control Smooth

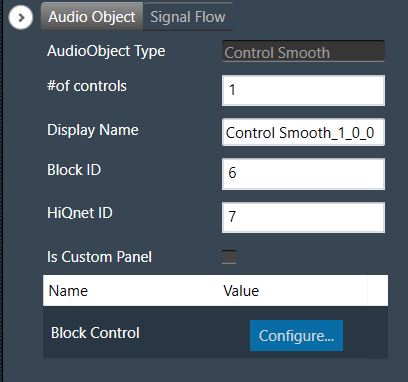
The Control Smooth audio object is used to smoothen the sharp changes in the control values before feeding them as control inputs to another AO. Sharp changes in the control value could cause artifacts in the audio output; in these situations, the Control Smooth audio object can be used to prevent artifacts.
For smoothening, this audio object uses a simple one pole filter that offers exponentially raising step response. 

Use Case: This Control Smooth audio object can be used where there is a necessity to avoid drastic changes in control values that are fed as control inputs to an audio object.  Below are few examples:

  • Interpolation between CAN updates.
  • Control value smoothing to help avoid chatter in AO blocks with control thresholds or hysteresis (eg. gearshift simulator, steady state fade-out control, RNC control for vehicle speed ON/OFF control).
  • Audio Objects that do not have support for ramping for change in control values.

Control Smooth Properties

Below table describes about the Control Smooth audio object properties and functionality.

Properties Description
Number of Controls Enter the number of control IO. The number of control inputs is same as the number of control outputs and the same is configurable via GTT. 

  • Range: 1 to 16
  • Default: 1
Display Name Display name of the Control Smooth audio object in signal flow design. It can be changed based on the intended usage of the object.

Mode

The Control Smooth object does not support any modes.

Additional Parameter

Parameter Description
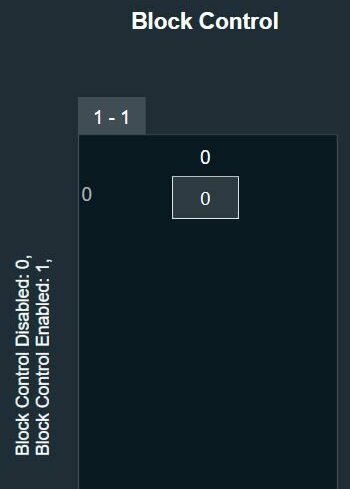
Block Control This variable is used to enable or disable block control.

  • 0 – Block Control Disabled (Default)
  • 1 – Block Control Enabled

Tuning Parameters

The object has the below three tuning parameters that are applicable for all the control inputs.

Parameter Description Data Type Range Default Unit
Bypass The Control Smooth object functionality can be bypassed with this option ULong 0 – Bypass OFF

1 – Bypass ON

0 None
Smooth Time Time taken by the smoothening filter to reach the target control value Float Block length duration to 10000 Block length duration ms
Hysteresis The tolerance below or above which the filter starts adapting to new target value Float 0 to 100 0 percent

Control Interface

Default number of control IO is 1 and configurable through the AO property – NumElements.

Native Panel

The Control Smooth object does not support native panel.

Parameter Biquad Panel

The ParameterBiquad panel can be used to apply Biquad filters to the signal. It is accessed through the Normal biquad object and Parameter biquad audio object, each offers different modes. When using parameter one or parameter one control set mode, channel selection is not required since the identical biquad parameters are applied to all channels within the device.

The frequency axis scale based on the minimum value of either the maximum value of Frequency StateVariable or (Selected Sample Rate / 2 )* 0.999.
Channel List

On the top left of the EqPanel, there is a list from which you can choose a channel for the current core. The current channel is marked with a green square and its details are displayed in the header of the channel list.

A screenshot of a computer Description automatically generated with medium confidence

EQ Chart

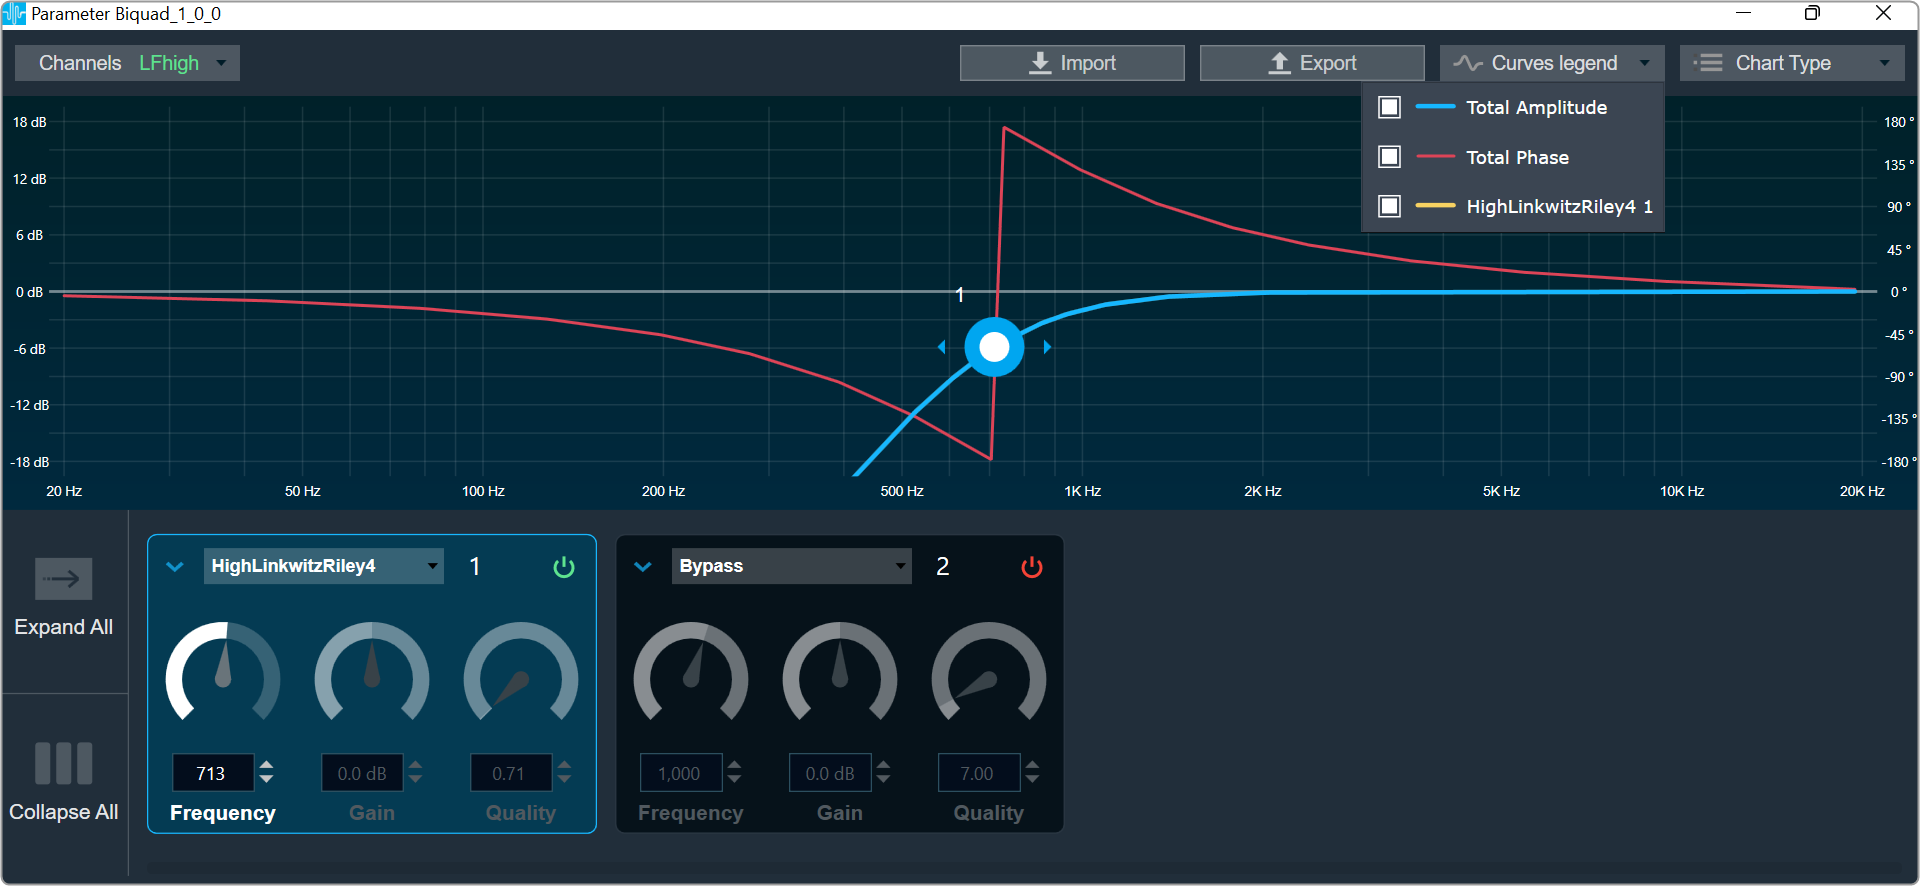
This chart represents the influence of all Biquads on the frequency and phase response. The left axis shows the amplitude in dB, and the right axis shows the phase in degrees. The number of Biquads are defined with the Signal Flow Designer. The Biquads get dynamically managed inside the GTT. Most of the Biquads are represented by appropriate markers.

A picture containing screenshot, line, plot Description automatically generated

Markers

Markers are movable. Moving them allows you to amend the current Biquad parameters. Each marker corresponds to one or two Biquad parameters. For example, the equalizer shown below has three markers.

A screenshot of a computer Description automatically generated with low confidence

Biquad Settings

On the Biquad settings window, you can perform the following operations.

Enabling Bypass

  • Click on the Bypass button to enable or disable Bypass.
  • In bypassed state, the button is red colored and green colored when biquad is in non-bypassed state.

Biquad is in bypassed state by default.

Change the Frequency, Gain, and Quality

  • Frequency: It is used to set the center frequency of each filter.
  • Gain: It is used to set the center frequency gain of each band of the filter. Not all filter types offer a variable gain.
  • Quality: It is used to set the width of each band pass or notch type band of the filter. Not all filter types offer a variable quality factor.
    • Using the increment and decrement buttons you can change the value.
      Or
    • Select the tuner and use mouse scroll to adjust the value

Change Biquad type

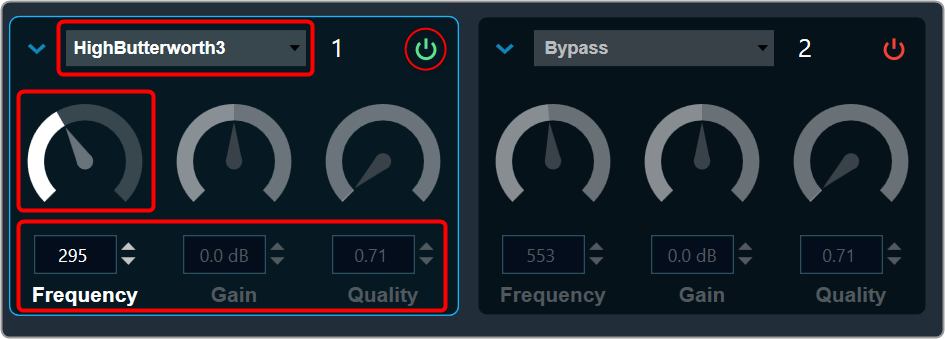
The Biquad Filter Menu shows a list of all Biquads types that are set up in the amplifier for the current channel. You can change the Biquad type or remove the Biquad by setting it to Bypass (at the top of the list).

A screenshot of a computer Description automatically generated with medium confidence

Biquad Chart Type

  • Amplitude phase: It is used to turn on and off appropriate charts.
  • Phase Unwrapped: It displays absolute values.
    • If the phase is wrapped, the display is limited to ± 180 °.
    • If the phase exceeds 180 ° or -180 ° it is continued on the other side of the vertical scale.
  • Used Biquads: This informs you about the available Biquads. The first number is the number of Biquads that have not been bypassed. The second number is the number of available Biquads.
  • Sample rate: It shows the sample rate at which the filters are operated.

Biquad Curve Legend

Click on Curve Legend to display all the associated legends. By default, all the curve legends are enabled on the graph. Uncheck the curve to hide it from the graph.

High Order Filters

The biquad object does not support natively high order filters. To work with high order filters, biquad panel can merge two low order filters into one high order filter automatically. Below table describes the rules of combining the filters.

First biquad Type Second biquad Type Comparison Result
HighPass2 HighPass1 B1Freq = B2Freq and B1Q = 1 HighButterworth3
HighPass2 HighPass1 1.03*B1Freq = 0.93*B2Freq and B1Q = 0.69 HighBessel3
HighPass2 HighPass2 B1Freq = B2Freq and B1Q = 1.31 and B2Q = 0.54 HighButterworth4
HighPass2 HighPass2 B1Freq = B2Freq and B1Q = 0.71 and B2Q = 0.71 HighLinkwitzRiley4
HighPass2 HighPass2 1.04*B1Freq = 0.93*B2Freq and B1Q = 0.81 and B2Q = 0.52 HighBessel4
LowPass2 LowPass1 B1Freq = B2Freq and B1Q = 1 LowButterworth3
LowPass2 LowPass1 B1Freq/1.03 = B2Freq/0.93 and B1Q = 0.69 LowBessel3
LowPass2 LowPass2 B1Freq = B2Freq and B1Q = 1.31 and B2Q = 0.54 LowButterworth4
LowPass2 LowPass2 B1Freq = B2Freq and B1Q = 0.71 and B2Q = 0.71 LowLinkwitzRiley4
LowPass2 LowPass2 B1Freq/1.04 = B2Freq/0.93 and B1Q = 0.81 and B2Q = 0.52 LowBessel4
  • B1Freq – first biquad frequency
  • B2Freq – second biquad frequency
  • B1Q – first biquad quality
  • B2Q – second biquad quality

Export & Import

A picture containing text, screenshot, clock, font Description automatically generated

Biquad parameters can be exported by clicking the export button as csv in the below format.

A screenshot of a calculator Description automatically generated with medium confidence

A screenshot of a computer Description automatically generated with low confidence

The exported file can be imported back to the panel using the import button.

Coefficient Biquad Native Panel

Coefficient biquad native panel is launched for the Coefficient biquad audio object. The panel has two modes.

  • Coefficient
  • Parameter

The frequency axis scale based on the minimum value of either the maximum value of Frequency StateVariable or (Selected Sample Rate / 2 )* 0.999.

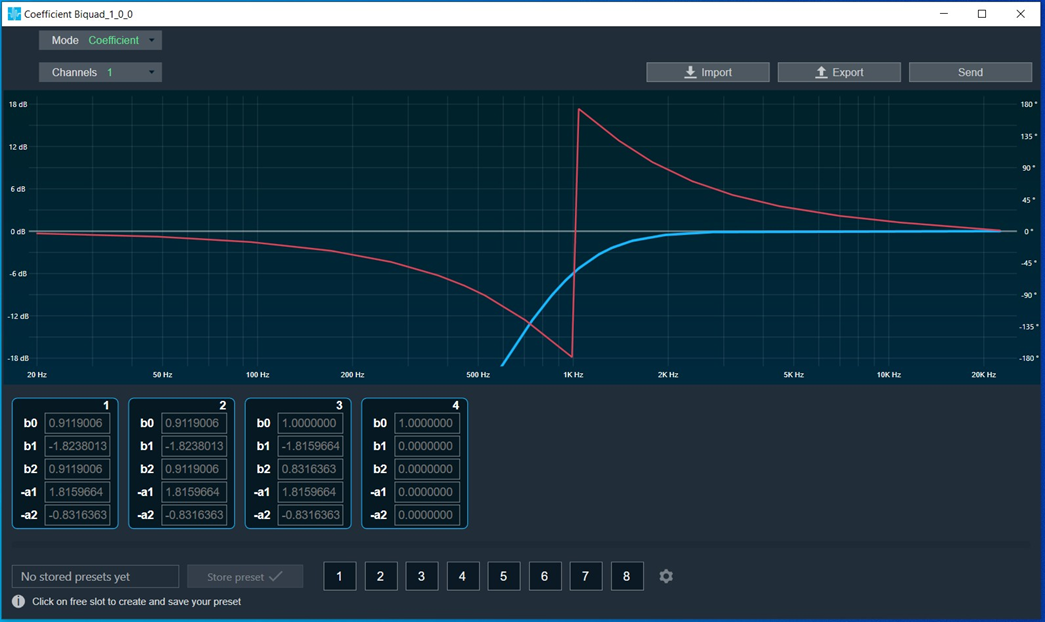
Coefficient Mode

Panel contains channel drop-down and option to import and export coefficients. The panel has a chart that has only total amplitude and total phase graphs.

The “Send” button sends the biquad coefficients to the device. The biquads configured will show up with 5 coefficients each numbered 1 to n.

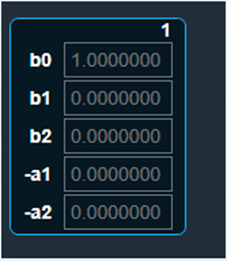
The coefficients will have default values 1,0,0,0,0.

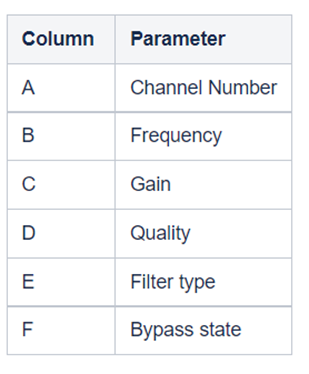
Coefficients cannot be edited. It can be filled only by importing coefficients from a .csv file. The format of the file is shown below.

A screenshot of a computer code Description automatically generated with low confidence

The current implementation will import coefficients to the biquads that are configured and leave the biquads that is not listed in the import file untouched. Please make sure you add default values to the ones that do not have coefficients.

Presets at the bottom to save different coefficient values are supported like any other native panels.

Parameter mode

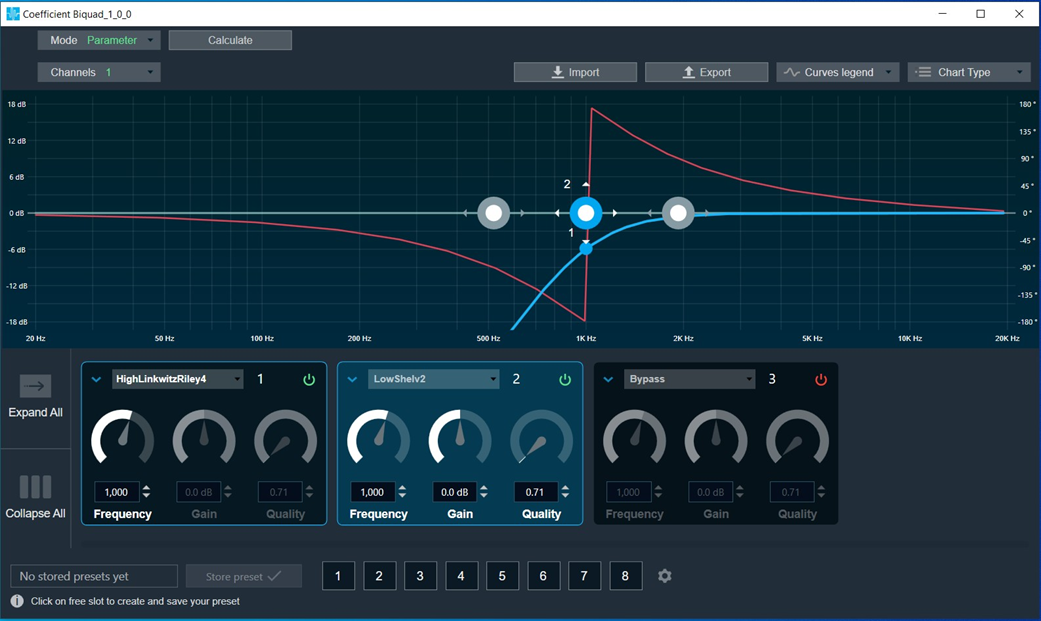
In this mode, you can set parameters using filters, just like in the EQ Panel. Parameters for all channels can be exported and imported.

The “Calculate” button calculates all parameters to coefficients but does not send them to the device. It switches to Coefficient mode so that they can be checked and sent with the “Send” button.

It is not possible to calculate coefficients to parameters, so it is possible that the coefficients will be different than the parameters. That is, the parameter mode may not reflect the state of the device/coefficients. It is possible after loading parameters sets, reading data from device or importing coefficients.

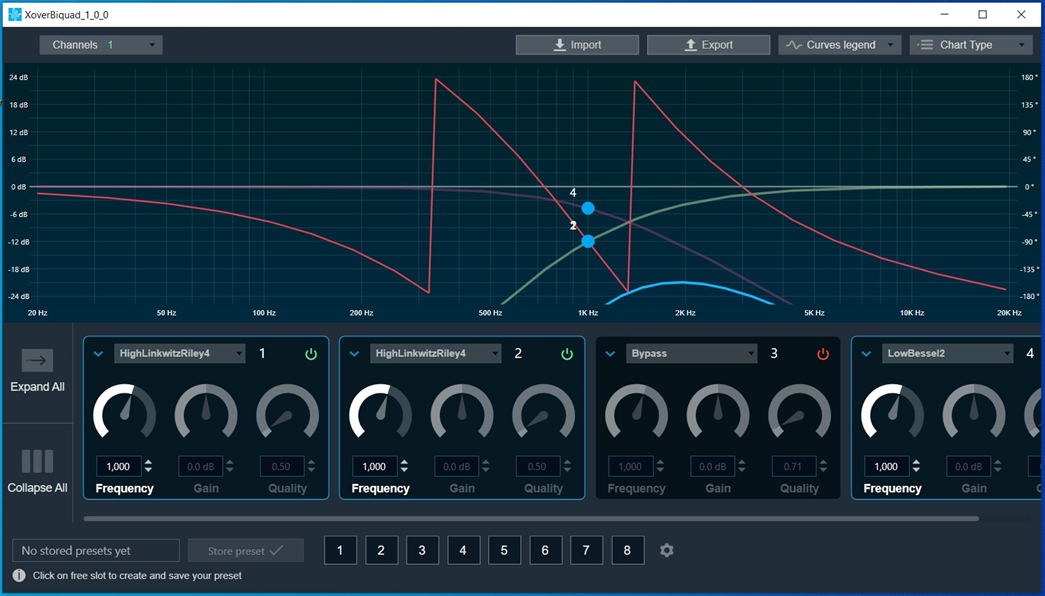
Xover Biquad Panel

The XoverBiquad panel is to tune XoverBiquad audio object. The audio object computes crossover bi-quadratic filter coefficients in the Xover Biquad panel, which also computes the output of the input audio buffers processed through the filters that users specify for each channel.

The frequency axis scale based on the minimum value of either the maximum value of Frequency StateVariable or (Selected Sample Rate / 2 )* 0.999.

Channel List

On the Xover Biquad panel, you have the option to choose a channel for the current core from a list located at the top left.
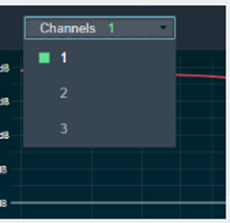
The current channel is marked with a green square and its number is displayed in the header of the channel list.

Xover Biquad Chart

This chart represents the influence of all Biquads on the frequency and phase response. The left axis shows the amplitude in dB, and the right axis shows the phase in degrees and the X- axis shows the gain.

The number of Biquads are defined with the Signal Flow Designer. The Biquads get dynamically managed inside the GTT. Most of the Biquads are represented by appropriate markers.

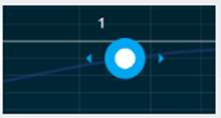
Markers

Markers are movable. Moving them allows you to modify frequency parameter.
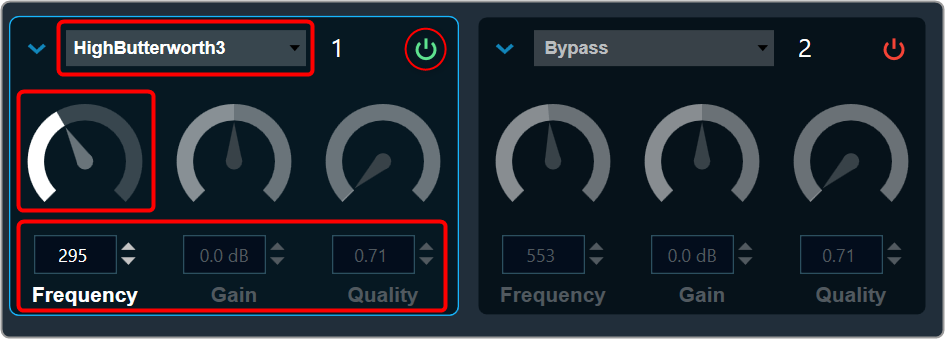
Biquad Settings
A screenshot of a computer Description automatically generated with medium confidence

Enabling Bypass

  • Click on the  Bypass button to enable or disable Bypass.
  • In bypassed state, the button is red colored and green colored when biquad is in non-bypassed state.

Biquad is in a bypassed state by default.

Even the higher order filter in Xover biquad only uses one biquad, so the number of bands assigned to the object will be equal to the number of biquads in the panel. Therefore, when the panel launches, it contains all of the biquads.

Change the Frequency, Gain, and Quality

Frequency: It is used to set the center frequency of each filter.

Gain: Gain is set to zero dB for all the filter types.

Quality: It is used to set the width of each band pass or notch type band of the filter. It is set to 0.58 for Bessel type filters, 0.50 for the LinkwitzRelay type filters and 0.71 for other types of filters.

  • Using the increment and decrement buttons you can change the value.
    Or
  • Select the tuner and use mouse scroll to adjust the value

Change Biquad type

The Biquad Filter Menu shows a list of all Biquads that are set up in the amplifier for the current channel. You can change the Biquad type in the combo box.
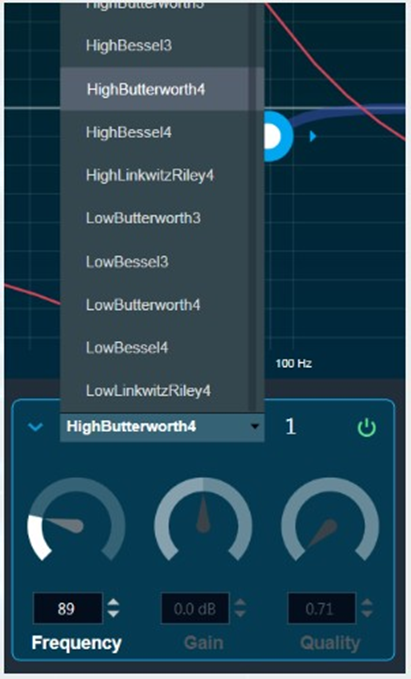
You cannot add new filters to the Xover Panel. All available filters are added and bypassed at panel startup.

Xover Biquad supports Higher order filters, hence there is no necessity to merge nor split of biquads.

Biquad Chart Type

A screenshot of a graph Description automatically generated with medium confidence

Amplitude phase: It is used to turn on and off appropriate charts.

Phase Unwrapped: It displays absolute values.

  • If the phase is wrapped, the display is limited to ± 180 °.
  • If the phase exceeds 180 ° or -180 ° it is continued on the other side of the vertical scale.

Used Biquads: This informs you about the available Biquads. The first number is the number of Biquads that have not been bypassed. The second number is the number of available Biquads.

Sample rate: It shows the sample rate at which the filters are operated.

This panel is supported from audio library version 13.0.0.2016 (M-release) onwards. After loading the library import the project again to launch the Xover panel.

Biquad Curve Legend

A screenshot of a computer program Description automatically generated with low confidence

Click on Curve Legend to display all the associated legends. By default, all the curve legends are enabled on the graph. Uncheck the curve to hide it from the graph.

Export & Import

Biquad parameters can be exported by clicking the export button as csv in the below format.

A picture containing text, screenshot, clock, font Description automatically generated

The biquad parameters can be exported in the following format by clicking the export button as a CSV file.

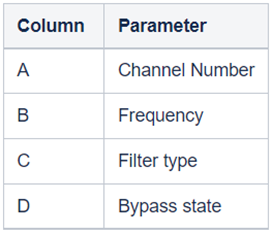
A screenshot of a computer Description automatically generated with low confidence

The exported file can be imported back to the panel using the import button.
Tone Control Extended Panel

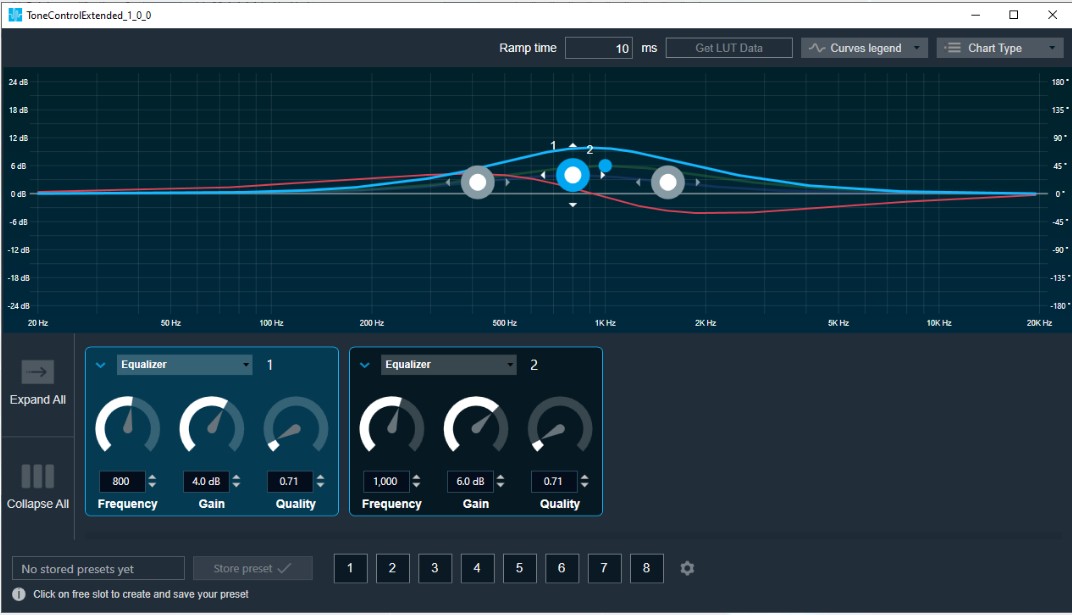
The ToneControlExtended panel is to tune ToneControlExtended audio object. The state variables of ToneControlExtended audio object can be updated using this panel.

The frequency axis scale based on the minimum value of either the maximum value of Frequency StateVariable or (Selected Sample Rate / 2 )* 0.999.

A screenshot of a computer Description automatically generated with medium confidence

Tone Control Extended Chart

This chart represents the influence of all bands on the frequency and phase response. The left axis shows the amplitude in dB, the right axis shows the phase in degrees and the X-axis shows the gain.

The number of Bands are defined with the Signal Flow Designer. The Bands get dynamically managed inside the GTT. Most of the Bands are represented by appropriate markers.

A picture containing screenshot, line, plot Description automatically generated

Markers

Markers are movable. Moving them allows you to amend the current Band parameters. Each marker corresponds to one or two Band parameters. For example, the equalizer shown below has three markers.

A picture containing screenshot, text, circle, font Description automatically generated

Band Settings

On the Band settings window, you can perform the following operations.

A screenshot of a computer Description automatically generated with low confidence

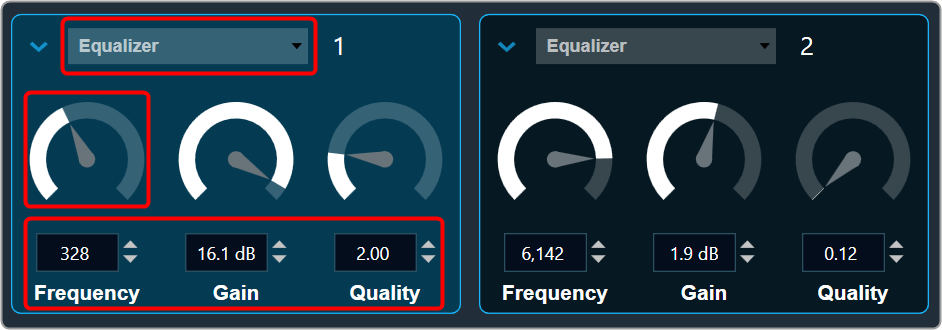
Change the Frequency, Gain, and Quality

Frequency: It is used to set the center frequency of each filter.

Gain: It is used to set the center frequency gain of each band of the filter. Not all filter types offer a variable gain.

Quality: It is used to set the width of each band pass or notch type band of the filter. Not all filter types offer a variable quality factor.

  • Using the increase and decrease buttons you can change the value.
    Or
  • Select the tuner and use mouse scroll to adjust the value.

All available filters are added, and default selection is set as All Pass 2 at panel startup.

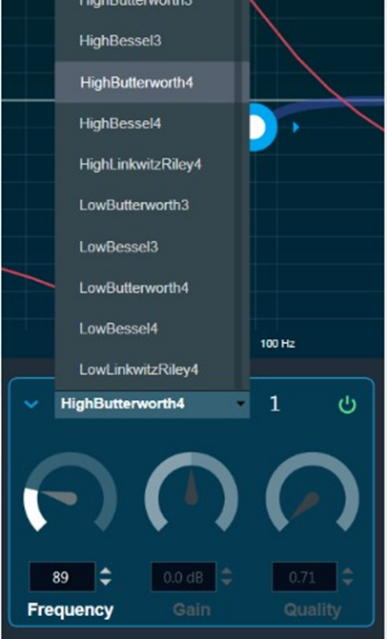
Change Band type

The Band Filter menu shows a list of all Bands that are set up in the amplifier for the current channel. You can change the Biquad type or remove the Band by setting it to Bypass (at the top of the list).

A screenshot of a computer Description automatically generated with medium confidence

Band Chart Type

A screen shot of a graph Description automatically generated with medium confidence

Amplitude phase: It is used to turn on and off appropriate charts.

Phase Unwrapped: It displays absolute values.

  • If the phase is wrapped, the display is limited to ± 180 °.
  • If the phase exceeds 180 ° or -180 ° it is continued on the other side of the vertical scale.

Used Biquads: This informs you about the available Biquads. The first number is the number of Biquads that have not been bypassed. The second number is the number of available Biquads.

Sample rate: It shows the sample rate at which the filters are operated.

Band Curve Legend

A screenshot of a computer Description automatically generated with medium confidence

Click on Curve Legend to display all the associated legends. By default, all the curve legends are enabled on the graph. Uncheck the curve to hide it from the graph.

  • Panel preset is used to store the tuning parameter.
  • Ramp time is used to set the ramp characteristic of the object.

In Tone Control Extended Panel, there is no channel selector since the band values are the same across all the channels.

Get LUT data

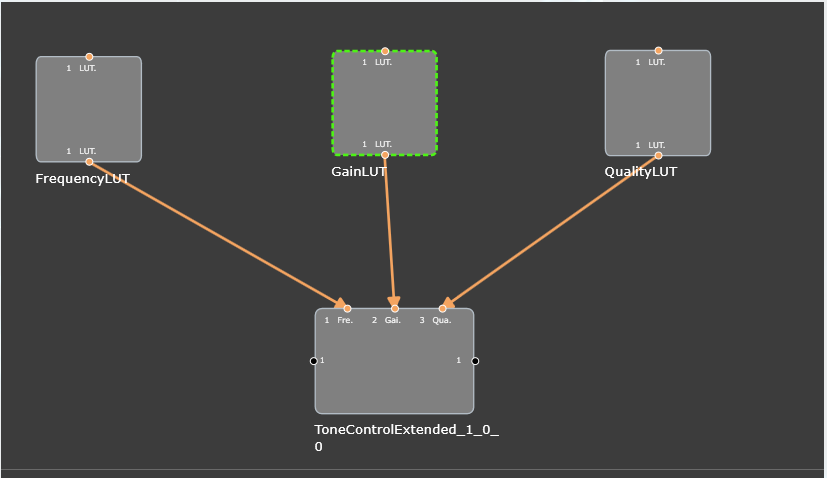
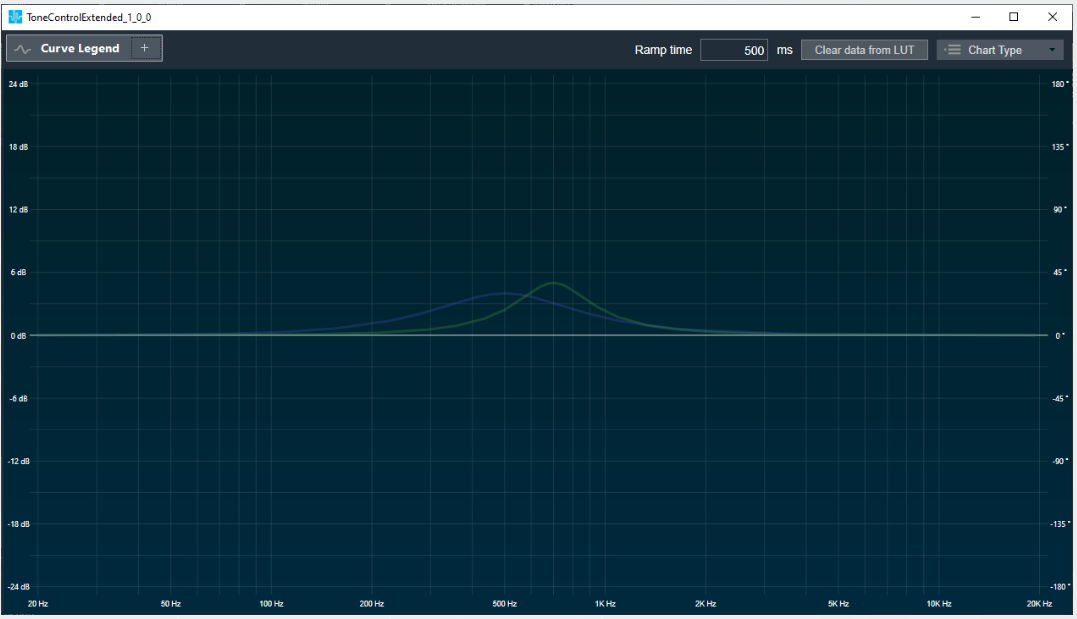
When a Tone Control Extended is connected to the LUT objects, the Tone Control Extended Panel displays the graph for the LUT data.

These graphs are just for visualization, you cannot alter the graph values from the panel.

  1. Connect the LUT objects to Control pins of Tone Control Extended objects.
    A screenshot of a computer Description automatically generated
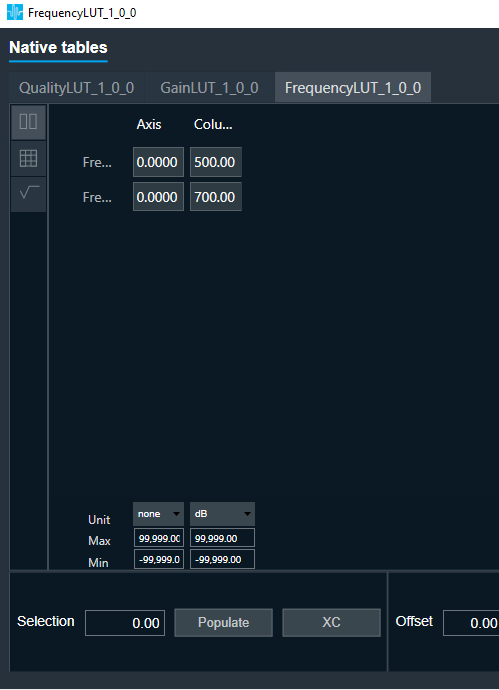
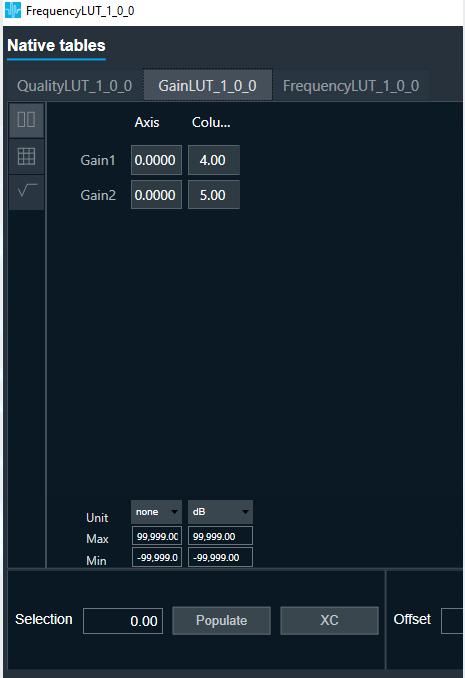
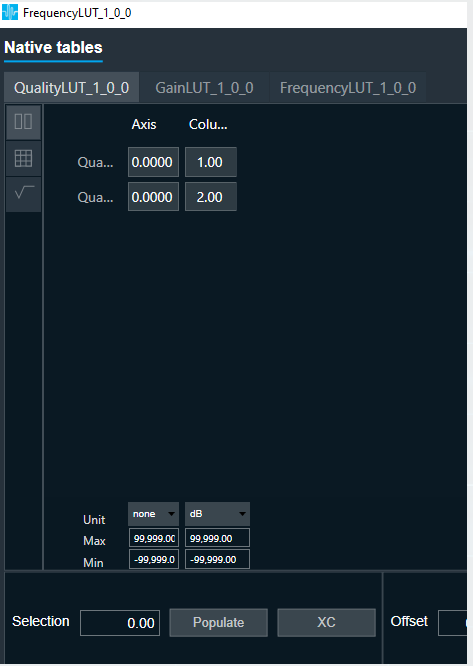
  2. Open LUT panel and set row, column name and values.
    A screenshot of a computer Description automatically generated A screenshot of a computer Description automatically generated A screenshot of a computer Description automatically generated
  3. Open Tone Control Extended panel and click Get LUT data. This will plot the graph for the LUT data.A screen shot of a graph Description automatically generated with medium confidence

If any one pin is not connected to LUT in a particular band, then corresponding tuning value will be used to plot curve.

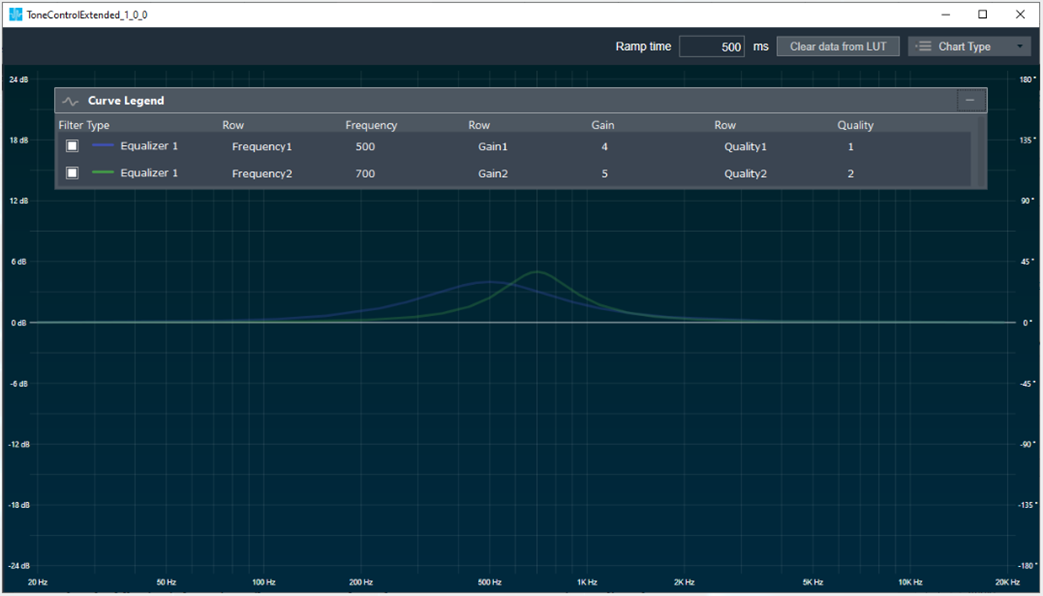
Curve Legend

  • This is a movable control and can be expanded or collapsed. It can be moved anywhere within the panel.
  • It has the following information: Filter Name, Band Number, Row Name, Frequency, Gain, Quality value.
    • Ex: Equalizer 1 Frequency1 500 Gain 4 Quality 1
  • Check box can be used to show/hide the specific curve
  • When corresponding row name is not available we will mark with “—“. This means the data comes from Tuning data “Clear LUT data” will switch back to the previous mode.

“Get LUT data” is supported only when it is directly connected to the LUT object.

Level Monitor Panel

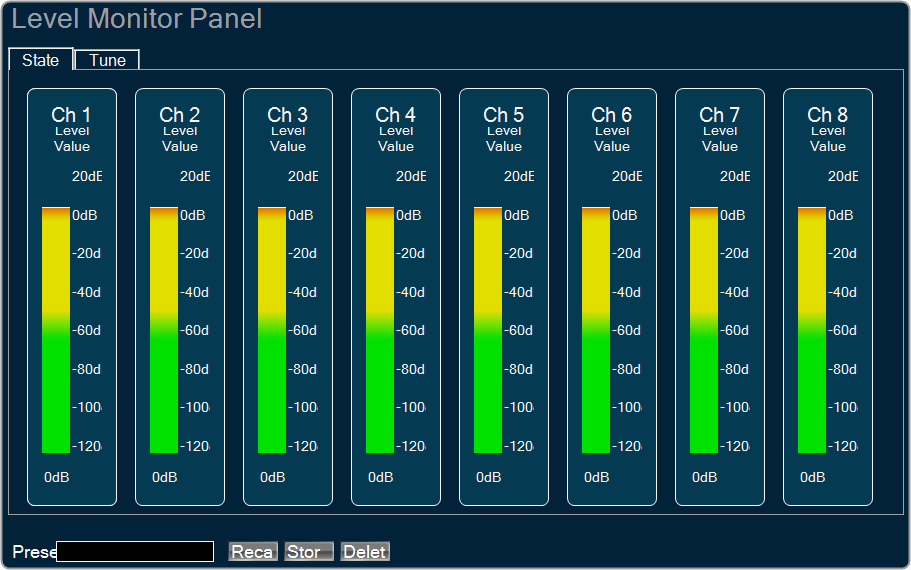
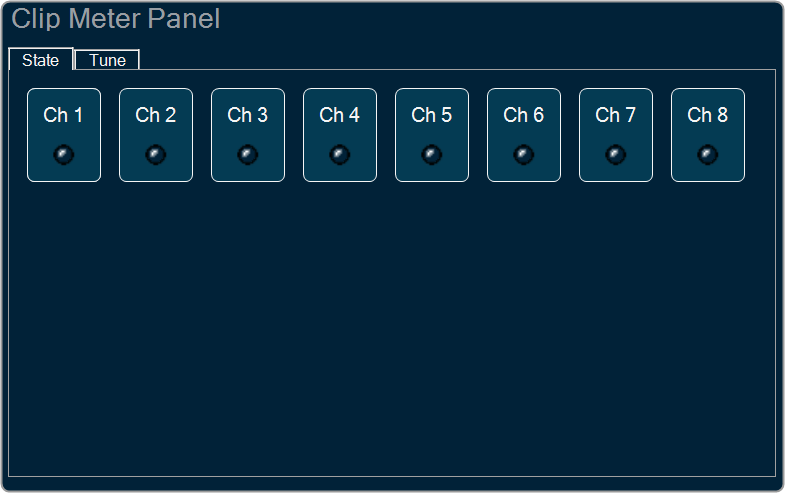
Level monitor custom native panel can be used to visualize measurements and to tune measurement parameters, like types of level values. Panel shows as many channels as it is specified in SFD.

Level Monitor object has 2 working mode.

  • Level Monitor: Level Monitor mode is used by engineers to measure level of volume in audio pipeline.
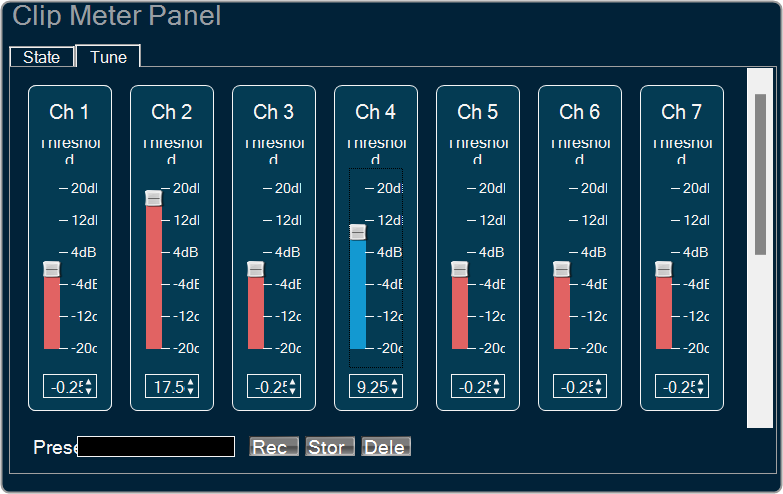
  • Clip Meter: Clip Meter mode is used to check if the level is causing clipping.

State tab is used to show the level values or clipping indicators. This tab is read only.
Tune and custom tabs are used to adjust measurement parameters.