The Graph display setting enables you to customize the appearance and behaviour of a graph or chart. These settings allow you to control the visual aspects of the graph, Min/Max of various parameters, as well as the overall layout style.
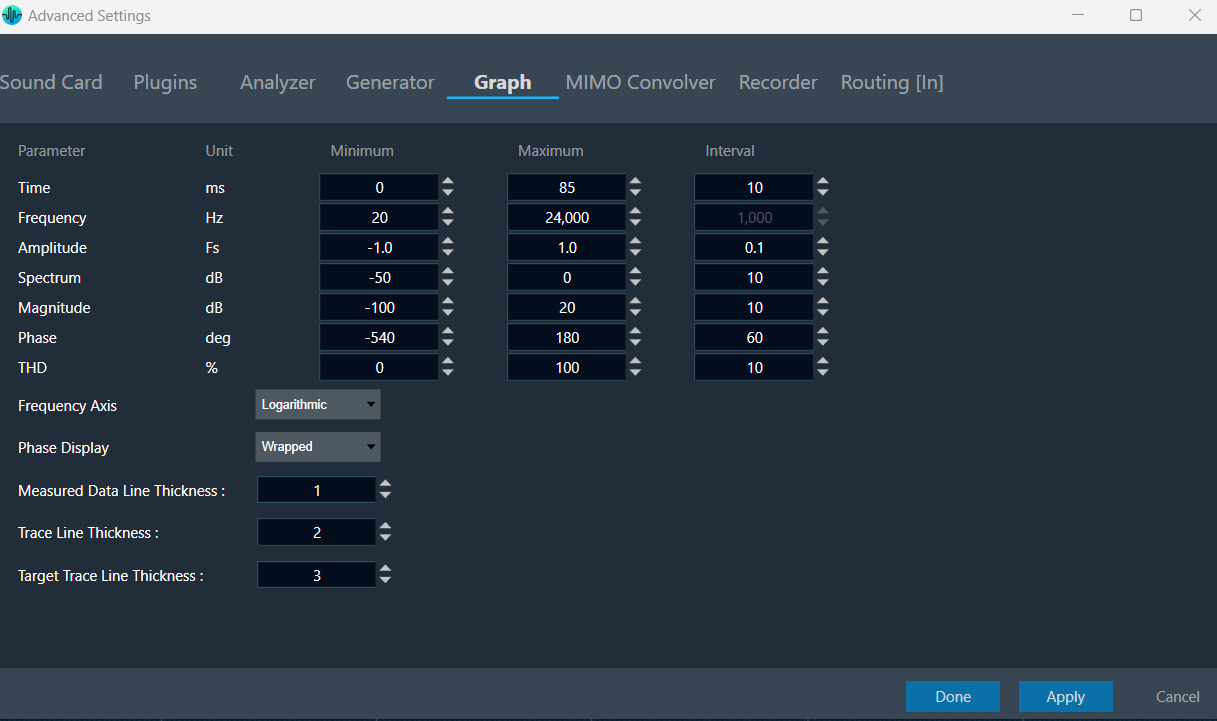
Following are settings you can configure in the “Graph” display.
- Set the Minimum and Maximum value for the Time/ Frequency/ Amplitude/ Spectrum/ Magnitude/ Phase/ THD parameter.
- Interval sets the delta of horizontal/vertical labels.
- Set Frequency axis as Logarithmic or Linear.
- Set Phase display as Wrapped or Unwrapped.
- Set the curve line thickness for Measured Data Line, Traces Line, and Target Traces Line.
After updating the graph settings, click on Done to save the changes. Ensure that values persist when importing or exporting a project.
Interval will be disabled for Log Scale.