Convolution is the process of multiplying the frequency spectra of our two audio sources: the input signal and the impulse response. By doing this, frequencies that are shared between the two sources will be accentuated, while frequencies that are not shared will be attenuated.
This phenomenon occurs when the input signal adopts the sonic characteristics of the impulse response, resulting in enhanced frequencies that are commonly present in both the impulse response and the input signal.

Steps to configure MIMO Convolver:
- Navigate to the IVP RTA tab and select Advanced from the ribbon bar. This opens the RTA Settings dialogue box.
- On the RTA Settings dialogue box, select the Plugins tab.
- Click on the folder icon to browse the xAF library path.
- Set the port number under the Port box.
- Enable the Bypass option (optional), if you prefer the input to be passed directly to the next plugin or output without undergoing any processing.
- Click on Apply. The number of inputs, number of outputs, and plugin type will be automatically updated based on the provided signal flow.
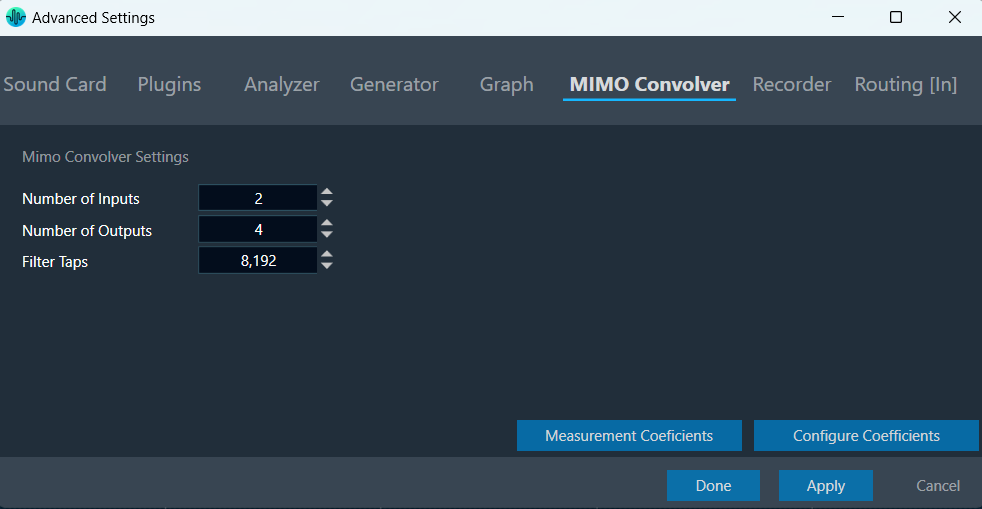
- Switch to the MIMO Convolver tab.
- Set the number of Inputs, Outputs, and Filter Taps.
You can configure coefficients in 2 ways.
- Configure coefficients in Panel.
- Configure coefficients through virtual prediction.
Configure coefficients in the Panel
- On the MIMO Convolver tab, click on Configure Coefficients. The Configure Coefficients panel launches with 2*2 filters.
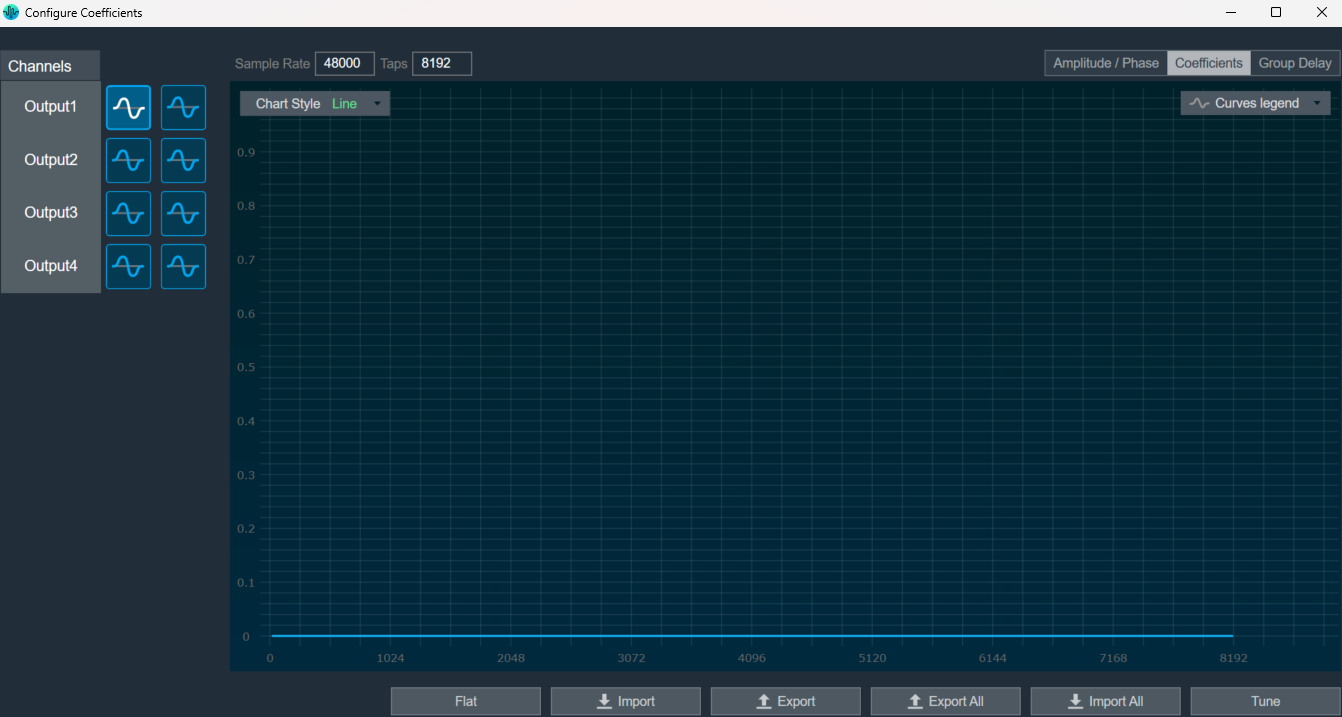
- Adjust the coefficients by either setting them to a flat value or importing them using CSV/XML files.
- Click on Tune, after assigning coefficients.
A toast message “Tuning applied” appears.
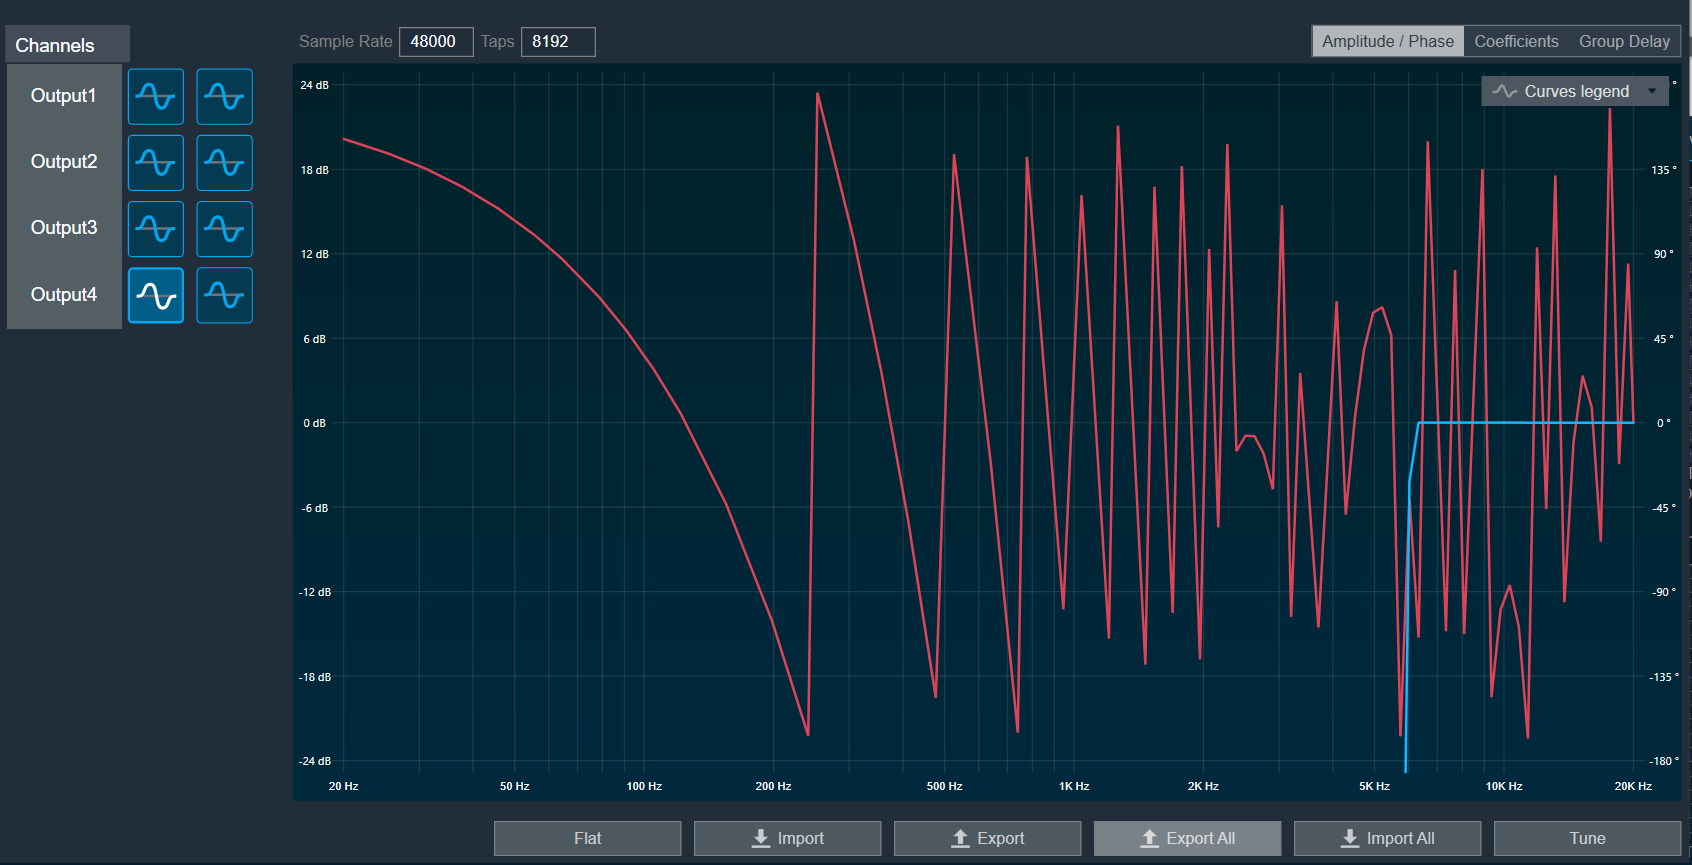
Amplitude/Phase: When the coefficients are given andthe “Amplitude/Phase” option is selected, the graph displays the value.
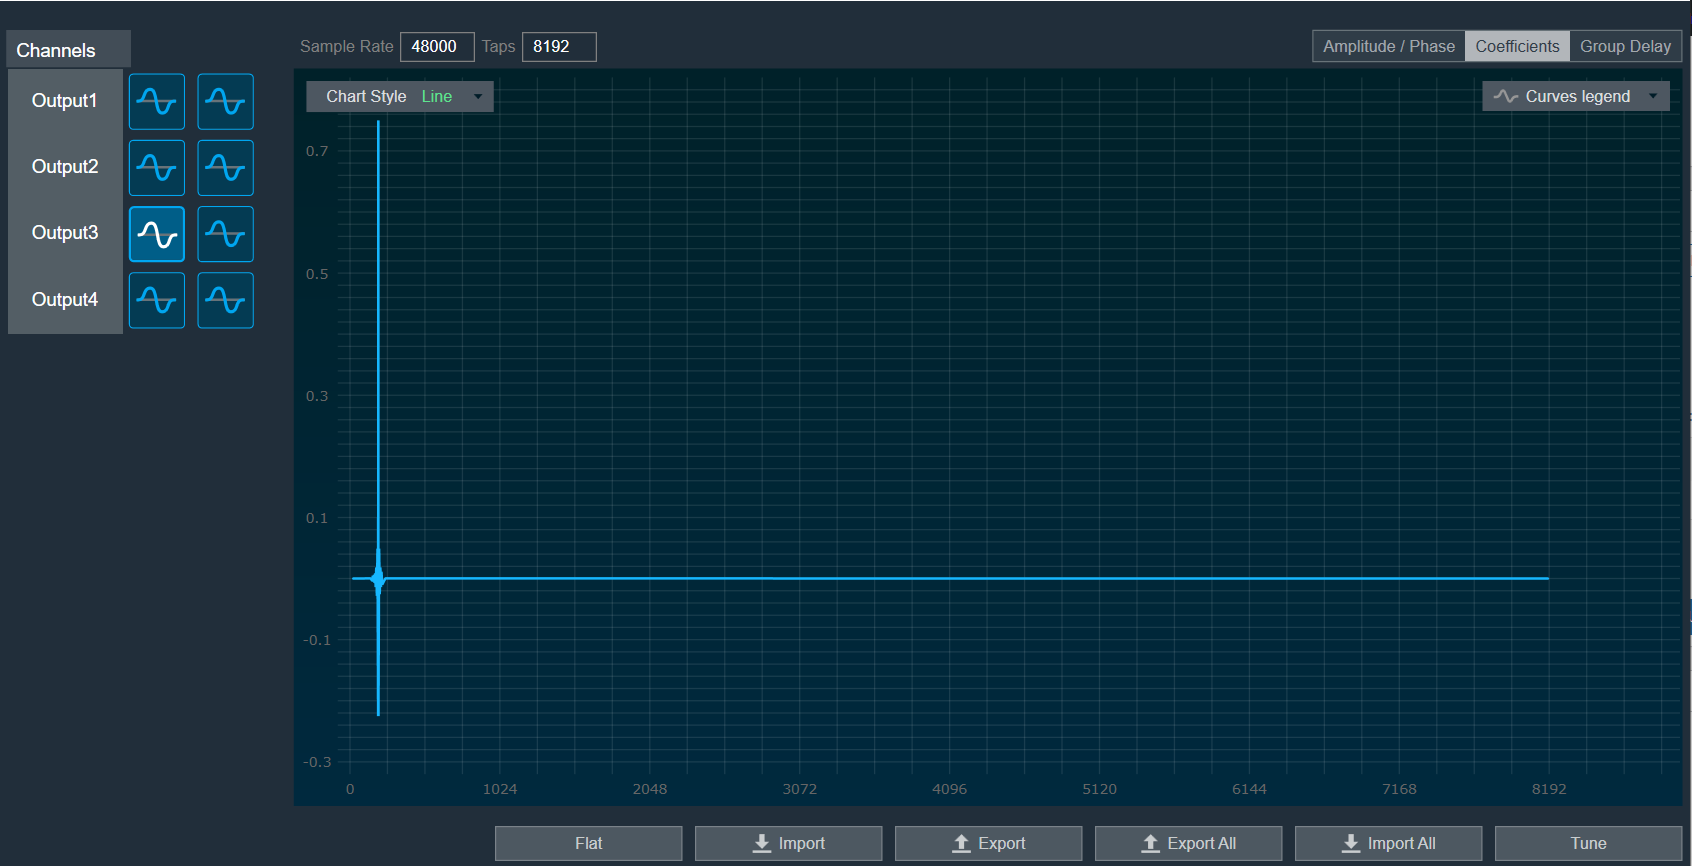
Coefficients: When the coefficients are given and the “Coefficients” option is selected, the graph displays the values as per the below figure. You can change the graph style using the “Chart Style” option.
| Line chart style: when “Chart Style” is selected as Line, the Coefficients graph. | 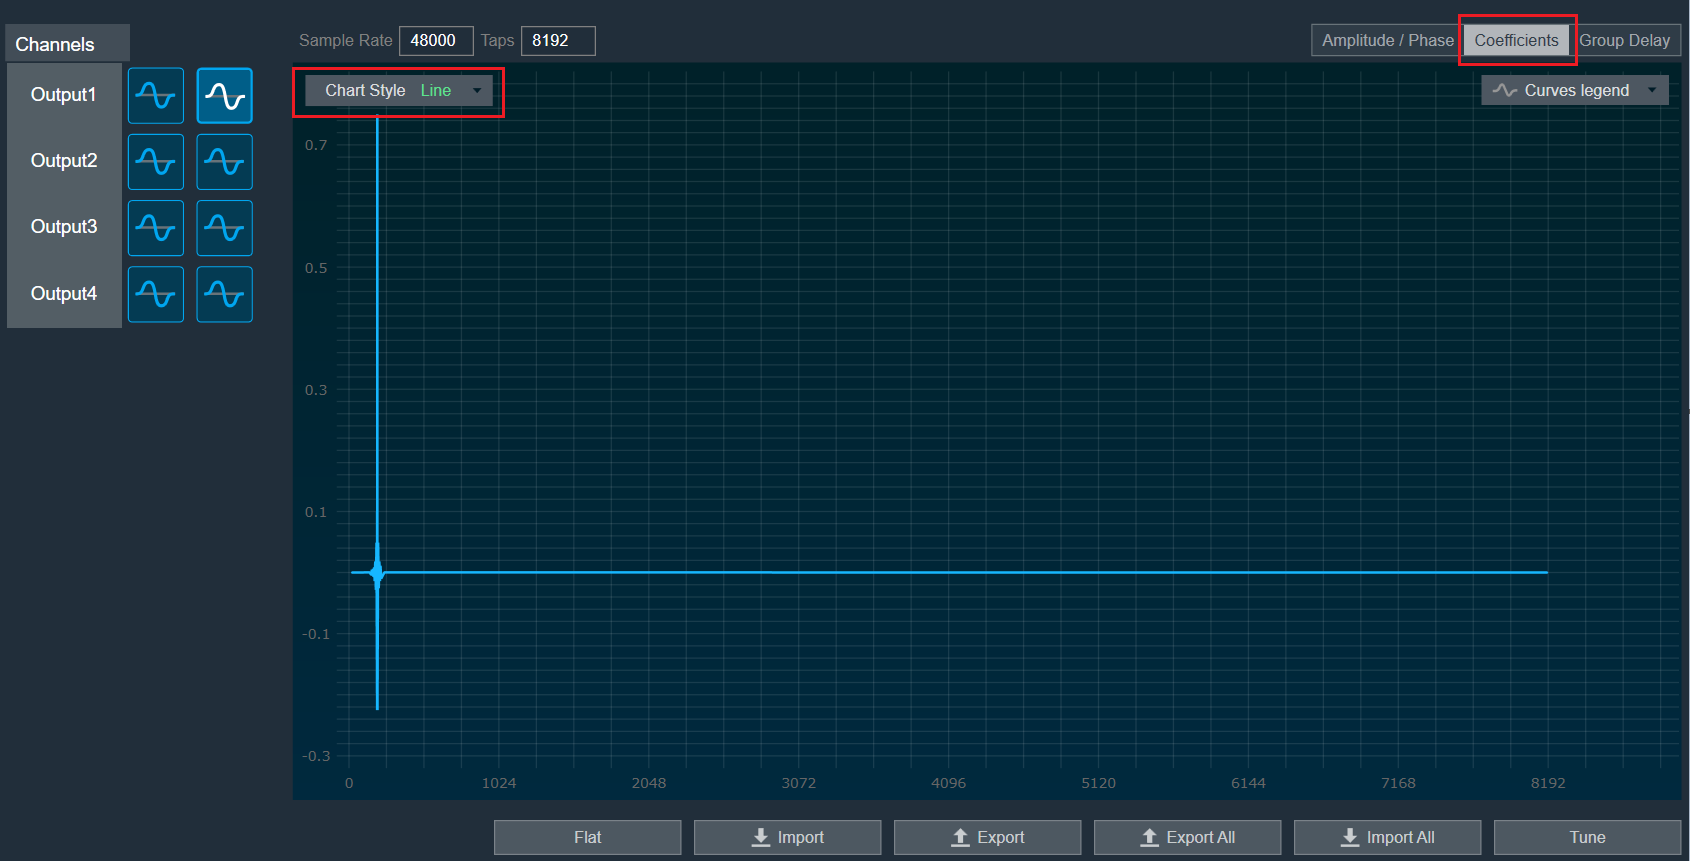 |
| Dot chart style: when “Chart Style” is selected as Dot, the Coefficients graph. | 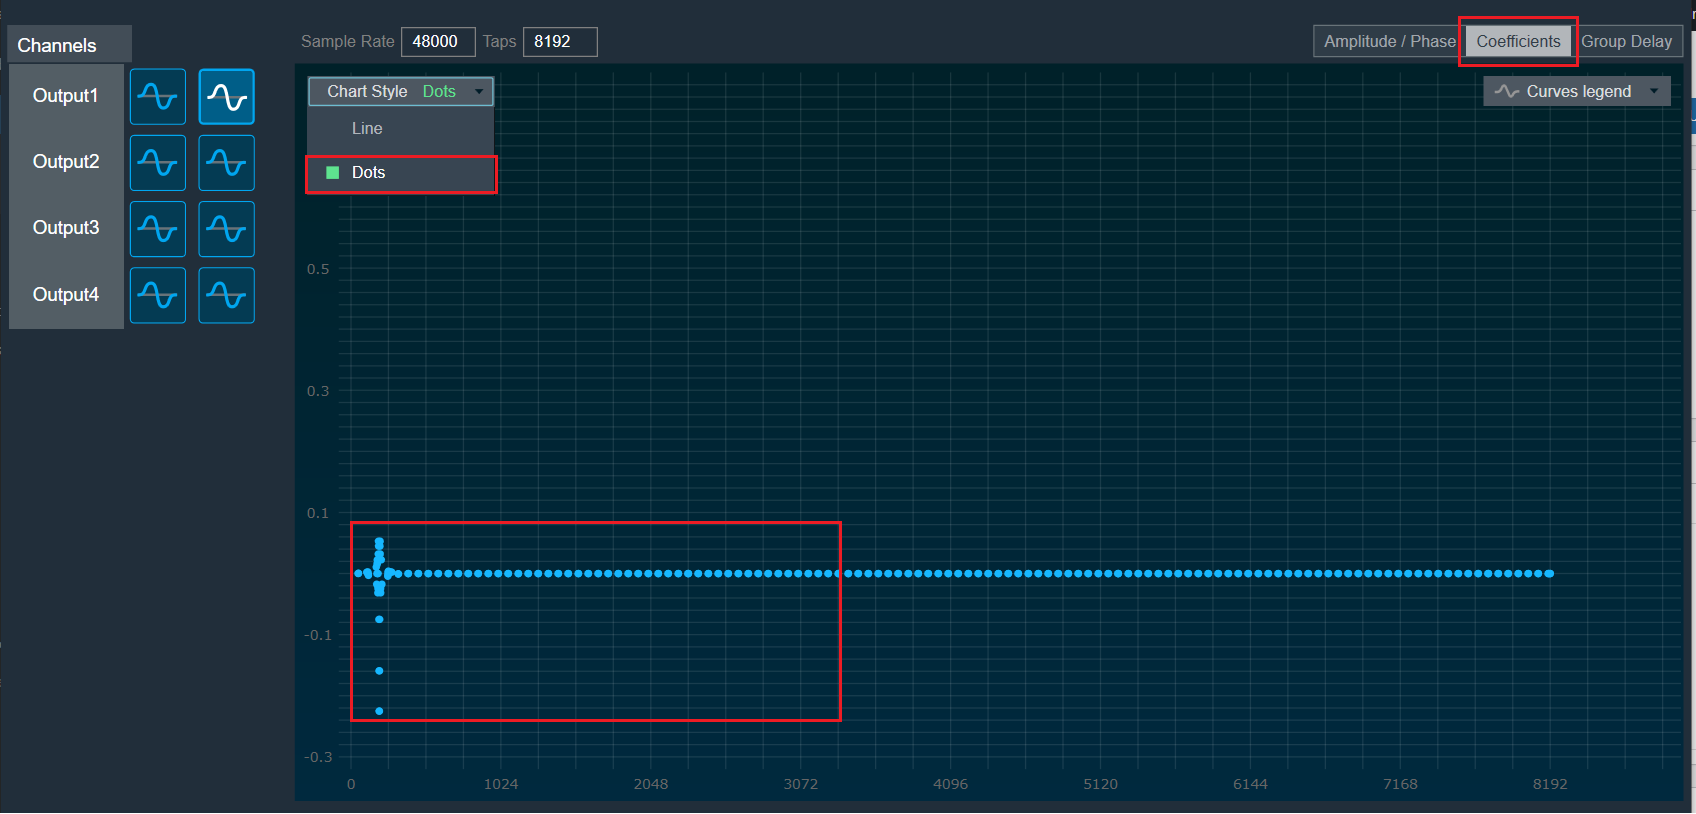 |
Group Delay: When the coefficients are given and the “Group Delay” option is selected, the graph displays the values.
Curves Legend: This option allows you to show the details of which graph tab (Amplitude/Phase, Coefficients, Group Delay) is selected.
| On the selection of the Amplitude/Phase graph tab Curves Legend will show the below information. | 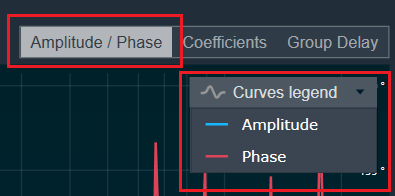 |
| On the selection of the Coefficients graph tab and Chart Styles ‘Dots’, Curves Legend will show the below information. | 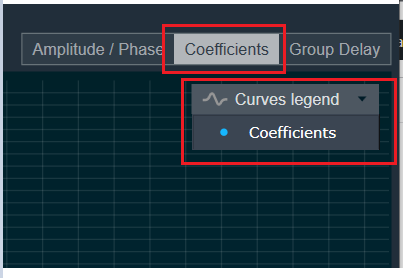 |
| On the selection of the Coefficients graph tab and Chart Styles ‘Line’, Curves Legend will show information. | 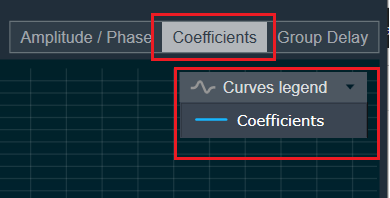 |
| On the selection of the Group Delay graph tab, Curves Legend will show information. | 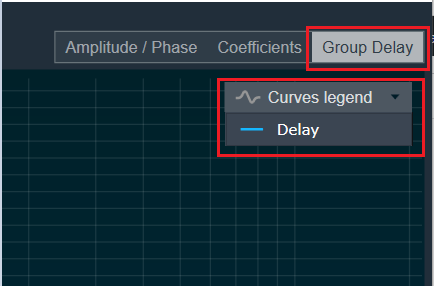 |
Additional Functionalities
- Flat: This is used to make the graph flat by making coefficients to 0.
- Import: This function is used to import the coefficients for a single active filter. Click on the “Import” button, then enter the file path and click Ok.
All coefficients for the selected filter will be imported, as shown in the graph. If the number of coefficients does not match the number of taps, a warning pop-up will appear. Click ‘Yes’ to import available coefficients or click ‘No’ to cancel the import. - Export: This option is used to export coefficients for selected active filters into a CSV file.
- Export All: This option is used to export all active filters in one go. Click on the “Export All” button, enter the path and file name, then click Ok. An XML file will be created which has coefficients for each active filter.
- Import All: This option is used to import all coefficients in one go. Click on the “Import All” button, enter the XML file path, and then click Ok. All the given coefficients will be imported and can be seen in the graph.
- Read: This is used to read from the target to display in the panel.
- Tune: This is used to apply a tune for the given value.
Configure Coefficients through Virtual prediction
- On the MIMO Convolver tab, click on Measurement Coefficients. The Virtual Tuning window appears.
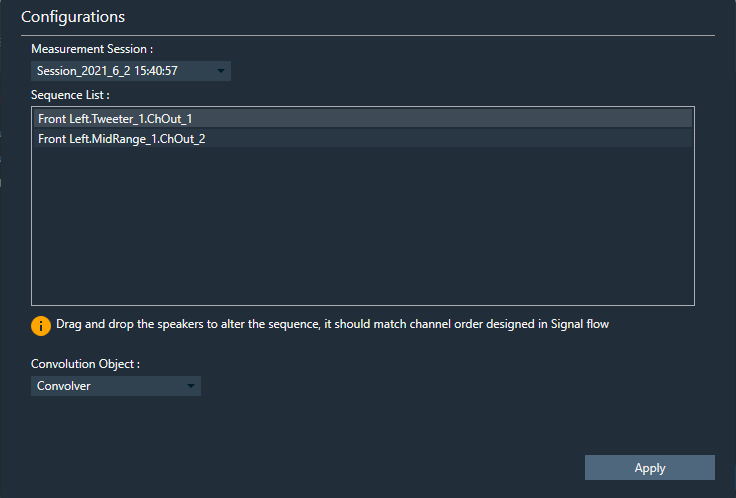
- Click Apply after selecting Measurement session from the drop-down list.
- Go to the Routing [in] tab.
- Set the inputs for “Plugin Host” (such as Generator1 and Generator2). These inputs will determine the channels from the Plugin Host that will be used.
- Set the inputs for “Mimo Convolver” in order to route the PluginHost output channels to the sound card outputs.
Example 1: PluginHost1 and PluginHost2, if the output of Plugin Host is fed to MIMO Convolver.
Example 2: Generator1 and Generator2, if generator is fed to MIMO Convolver.
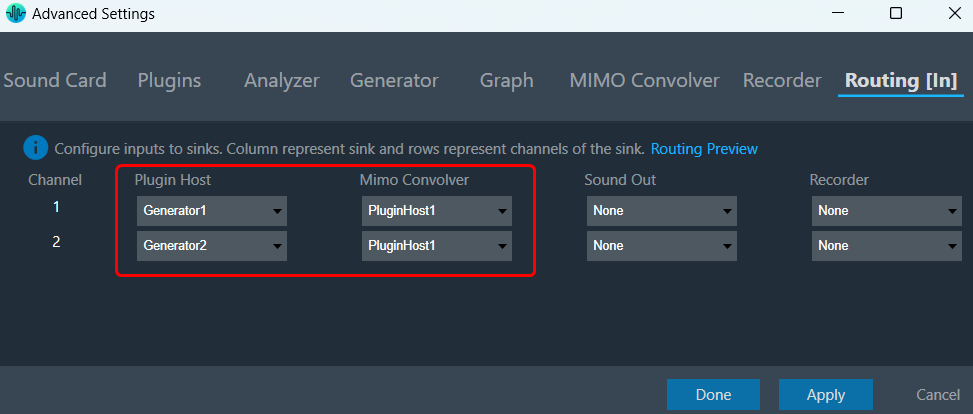
- Go to the Analyzer tab and select Plugin Host (MIMO convolver) output as the channel source.
- Set the Channel source (such as Generator1, PluginHost1, and MimoConvolver1) to display in the chart.
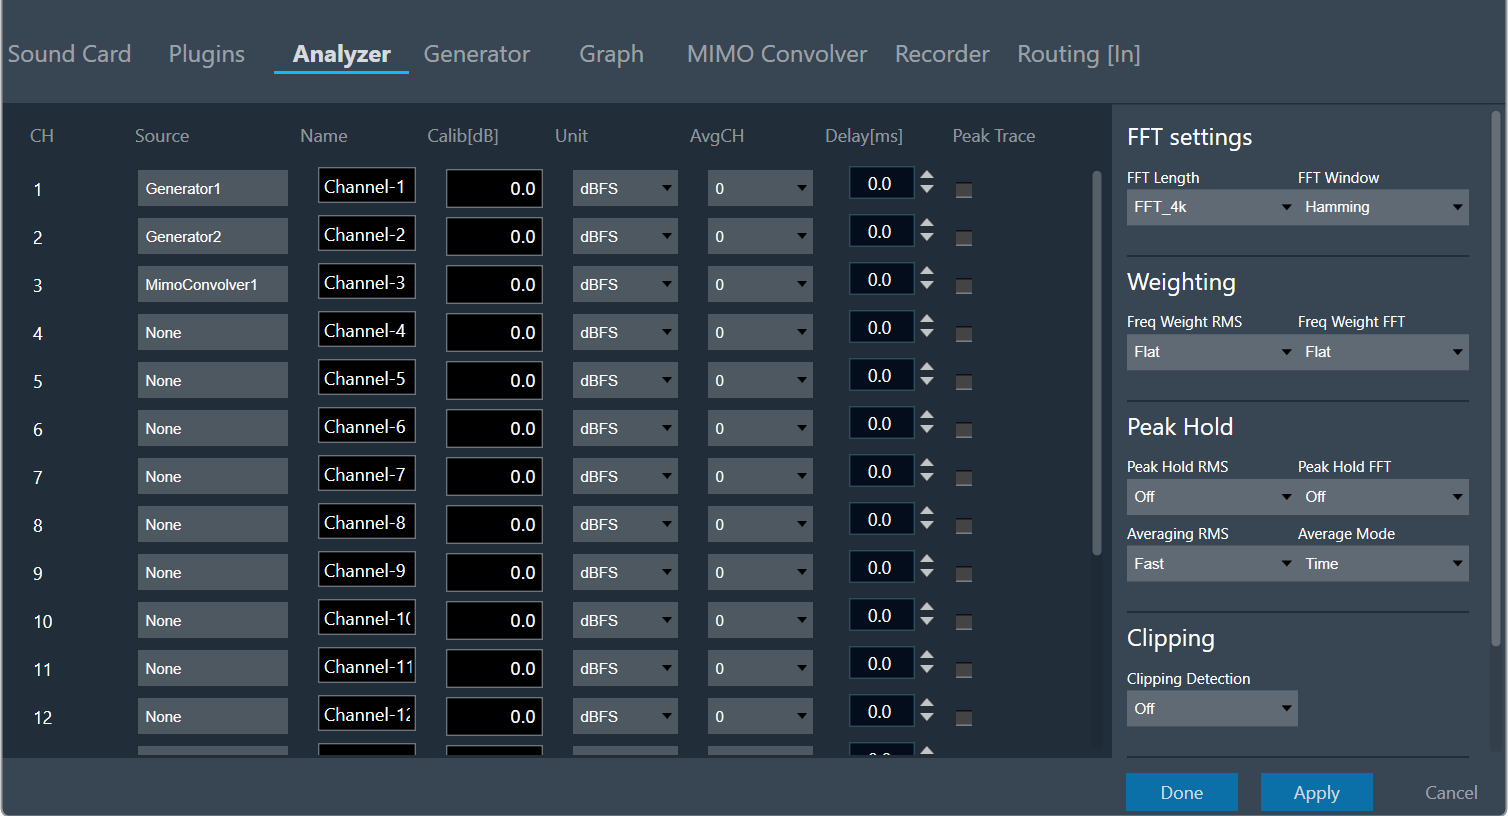
- Once the settings have been updated, click Done.
- Connect to the device through Plugin Host. For more details, refer to Plugin Host Setting.
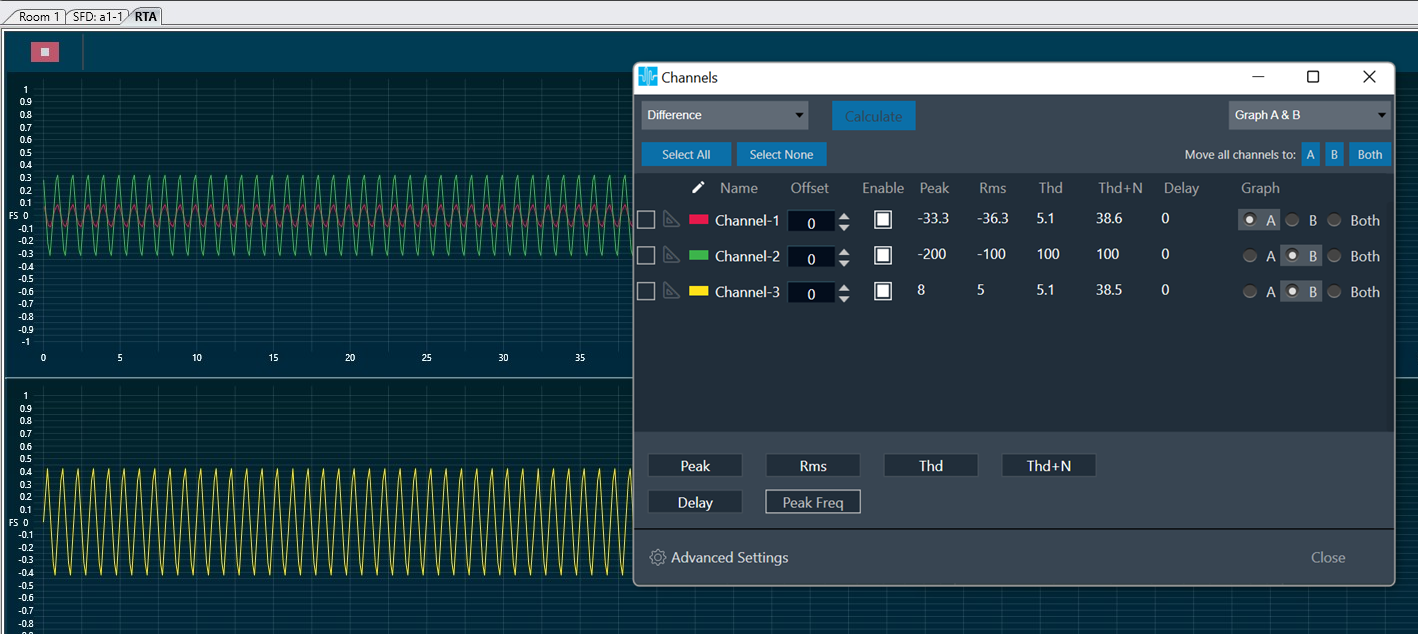
- Open Channels, and assign channels to Graph A and Graph B.
A chart with Genertor1, PluginHost1, and MimoConvolver1 outputs appears.
