Traces allows you to display multiple captures of measurement curves on a single plot, allowing for quick and convenient comparisons of the measurements. The controls for traces are located on the right side of the spectrum graph.
A trace in RTA is a captured measurement curve.
There are eight different kinds of traces:
- Spectrum: Complete data set from measurement without phase.
- Phase: Complete data set from measurement with phase data.
- Txt: Data imported from a text file (tab separated frequency – spectrum value pairs per line)
- Ovl: Data imported from an Overlay file format.
- HATS: Data imported from HATS software exported text file.
- Central Viewer: Data imported from Central Viewer exported Magnitude data text file.
- Eq: Target curve, a spectrum curve described by biquad filter parameters.
- Peak Hold: Peak hold trace with three-time constants.
Traces view is available only in Frequency Domain analyzer modes like Spectrum, Phase i.e. it is not available in Time Domain.
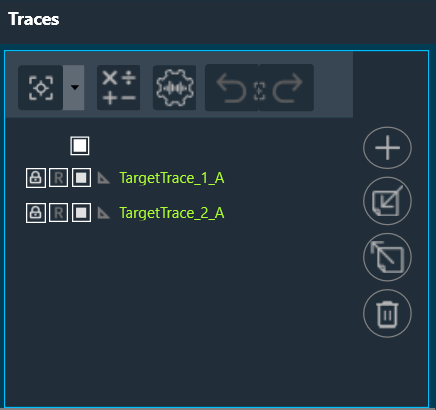
The trace menu is comprised of a trace toolbar and a trace list.
Each entry in the trace list includes a button for re-capturing, a checkbox for selection, and a trace label. The selection checkbox is used to designate the trace for mathematical operations.

Double-click on the trace label opens the trace property dialogue.
In this dialog, you can set the name, offset, and color for each trace. You can view all SPL (ABC) values simultaneously, which will aid in final documentation purposes. Additionally, “Next” and “Back” buttons are provided, allowing you to navigate through multiple traces and make edits to them simultaneously.
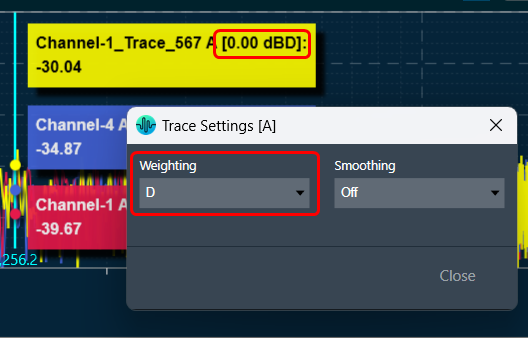
If you select SPL Weighting in the trace settings, you can choose to display it on the trace list without affecting the graph or live value measurements.

Related Topics

