Table of Content

FFT for Streaming
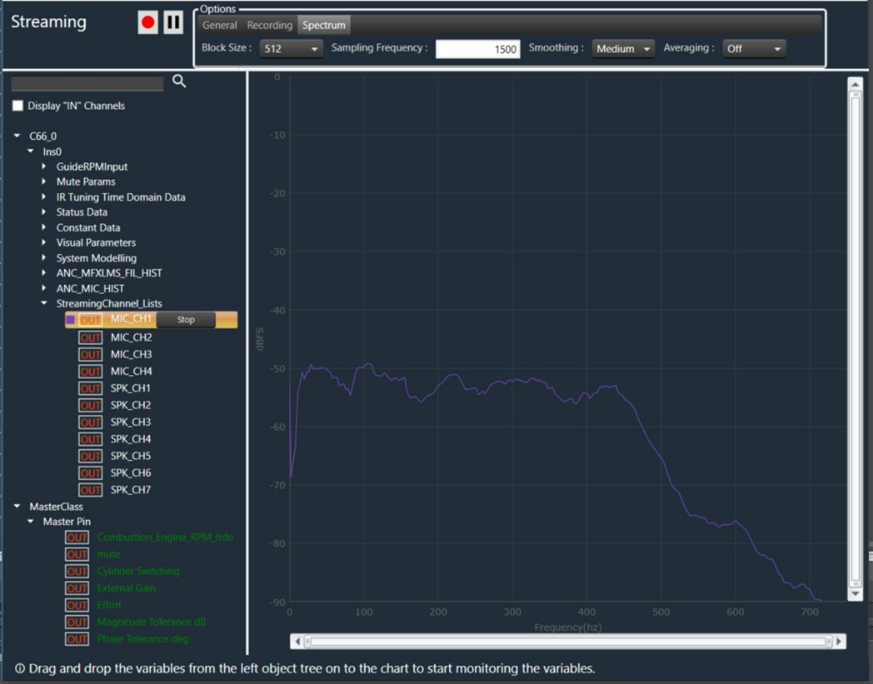
FFT Analysis capabilities are also available in the streaming window, wherein the FFT analysis of incoming audio signals is undertaken in real-time, depending upon the block size, additional calculations, etc).
The “Display Type” selection under the General tab provides the option to switch between Time and Frequency domain display.
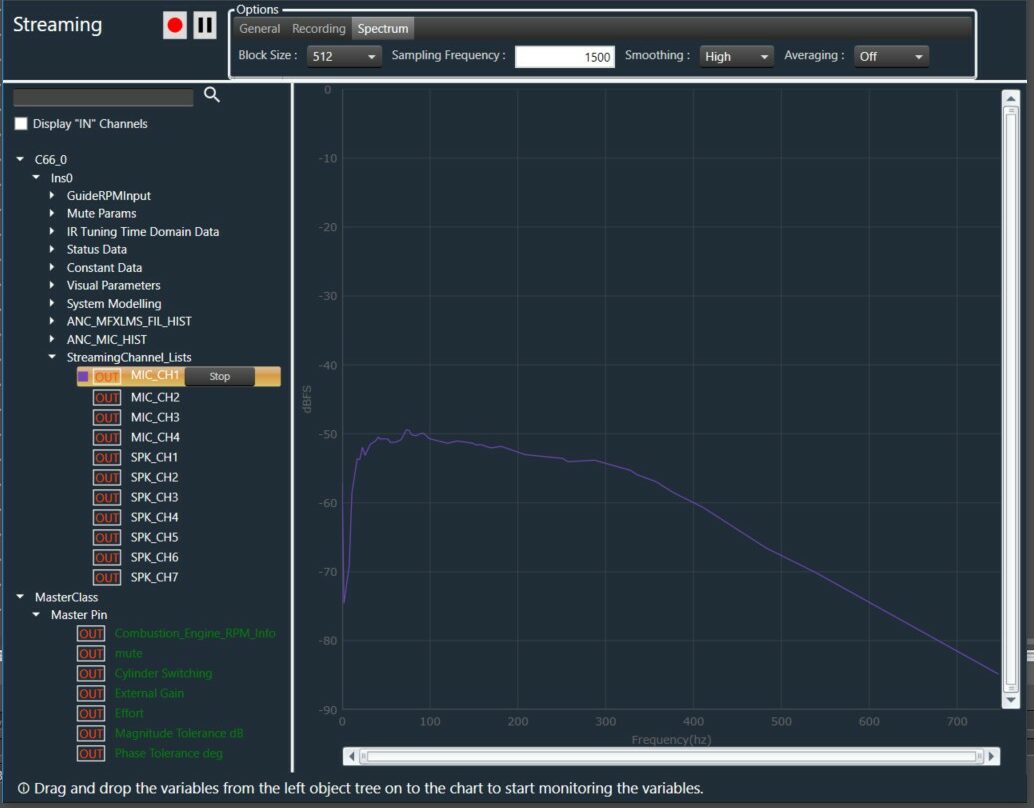
When the Display Type is set to “Frequency Domain”, the Spectrum functionality of Streaming can be viewed.
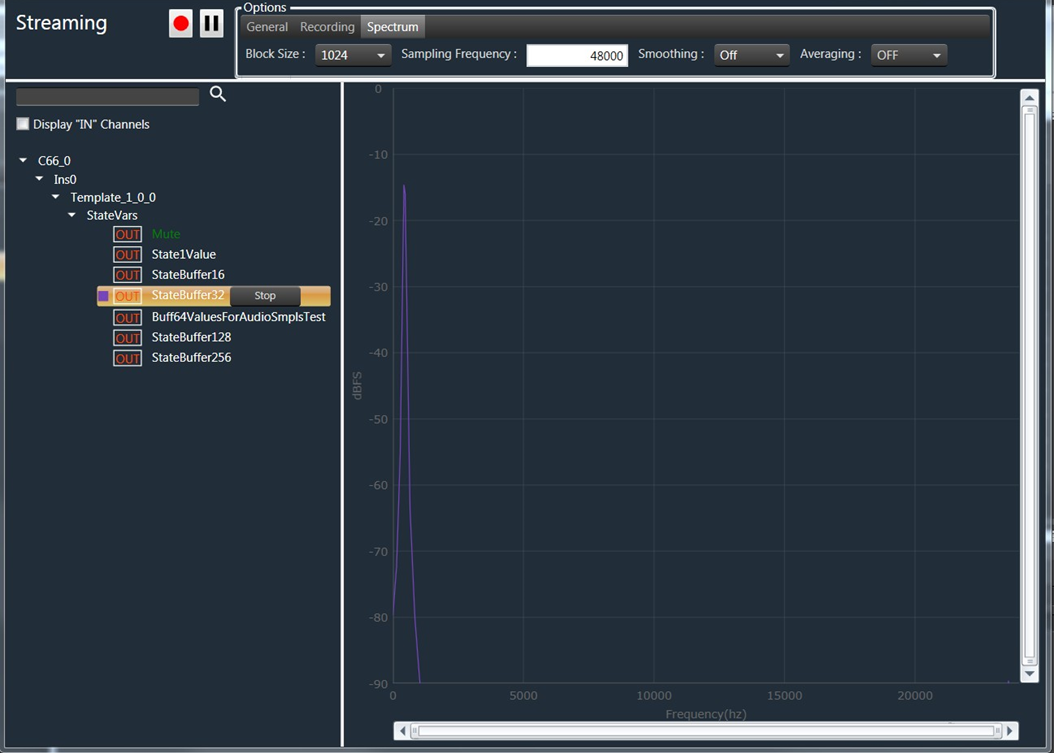
In Spectrum view the X-axis ranges from “0 to Sampling Frequency / 2”, and Y-Axis ranges from “0 to -90 dbFS”.
Providing the correct sampling frequency is the responsibility of the audio engineer, and it should match the sampling frequency of the streaming state variable.
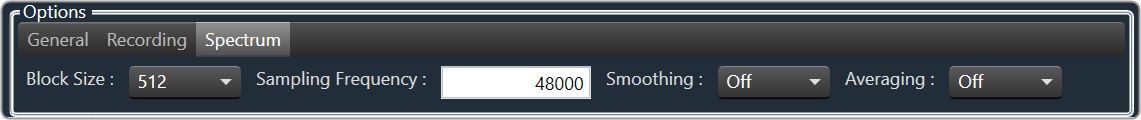
The Spectrum properties such as Block size, Sampling Frequency, Smoothing, and Averaging can be configured according to your requirements.
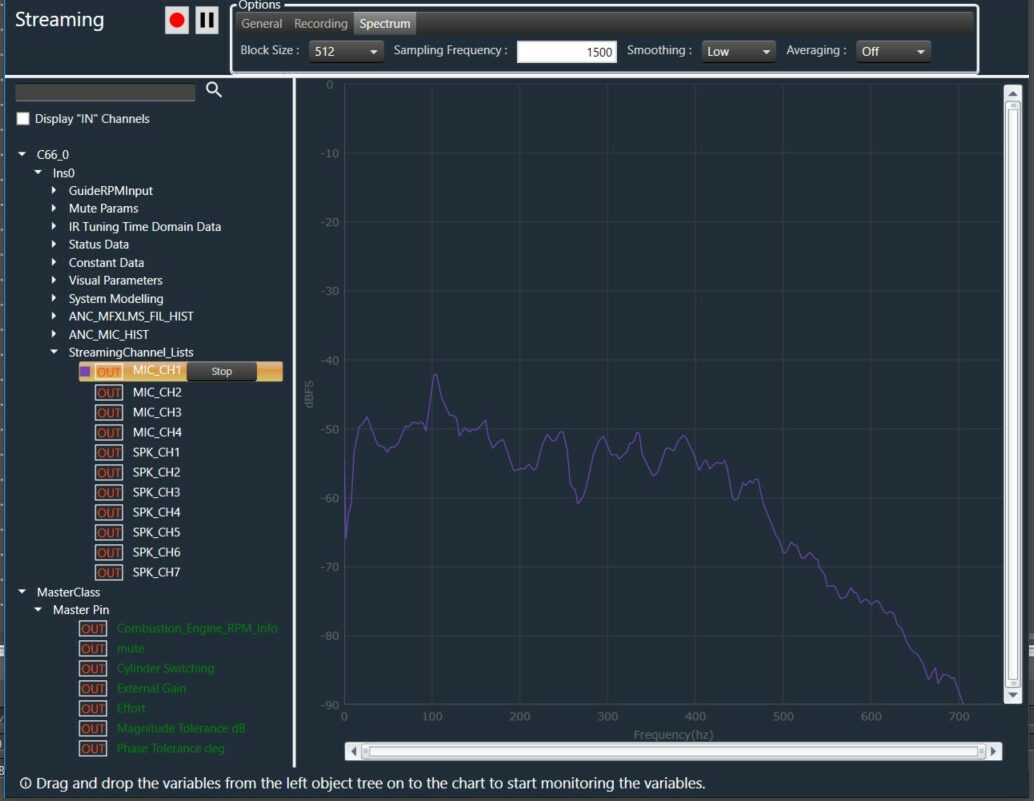
The variable “MaxWinSize” determines the maximum window size for smoothing in the Spectrum functionality. It has three options: Low (20), Medium (40), and High (1000). Choosing a larger number will result in a smoother curve.
For instance, if you set the limit to 500 Hz, all bins in the upper frequency range will be smoothed by averaging a window width of 500 Hz.
Example: Smoothing set to Off.

Example: Smoothing set to Low.
Example: Smoothing set to Medium.
Example: Smoothing set to High.