Table of Content

Launch Memory Profiling
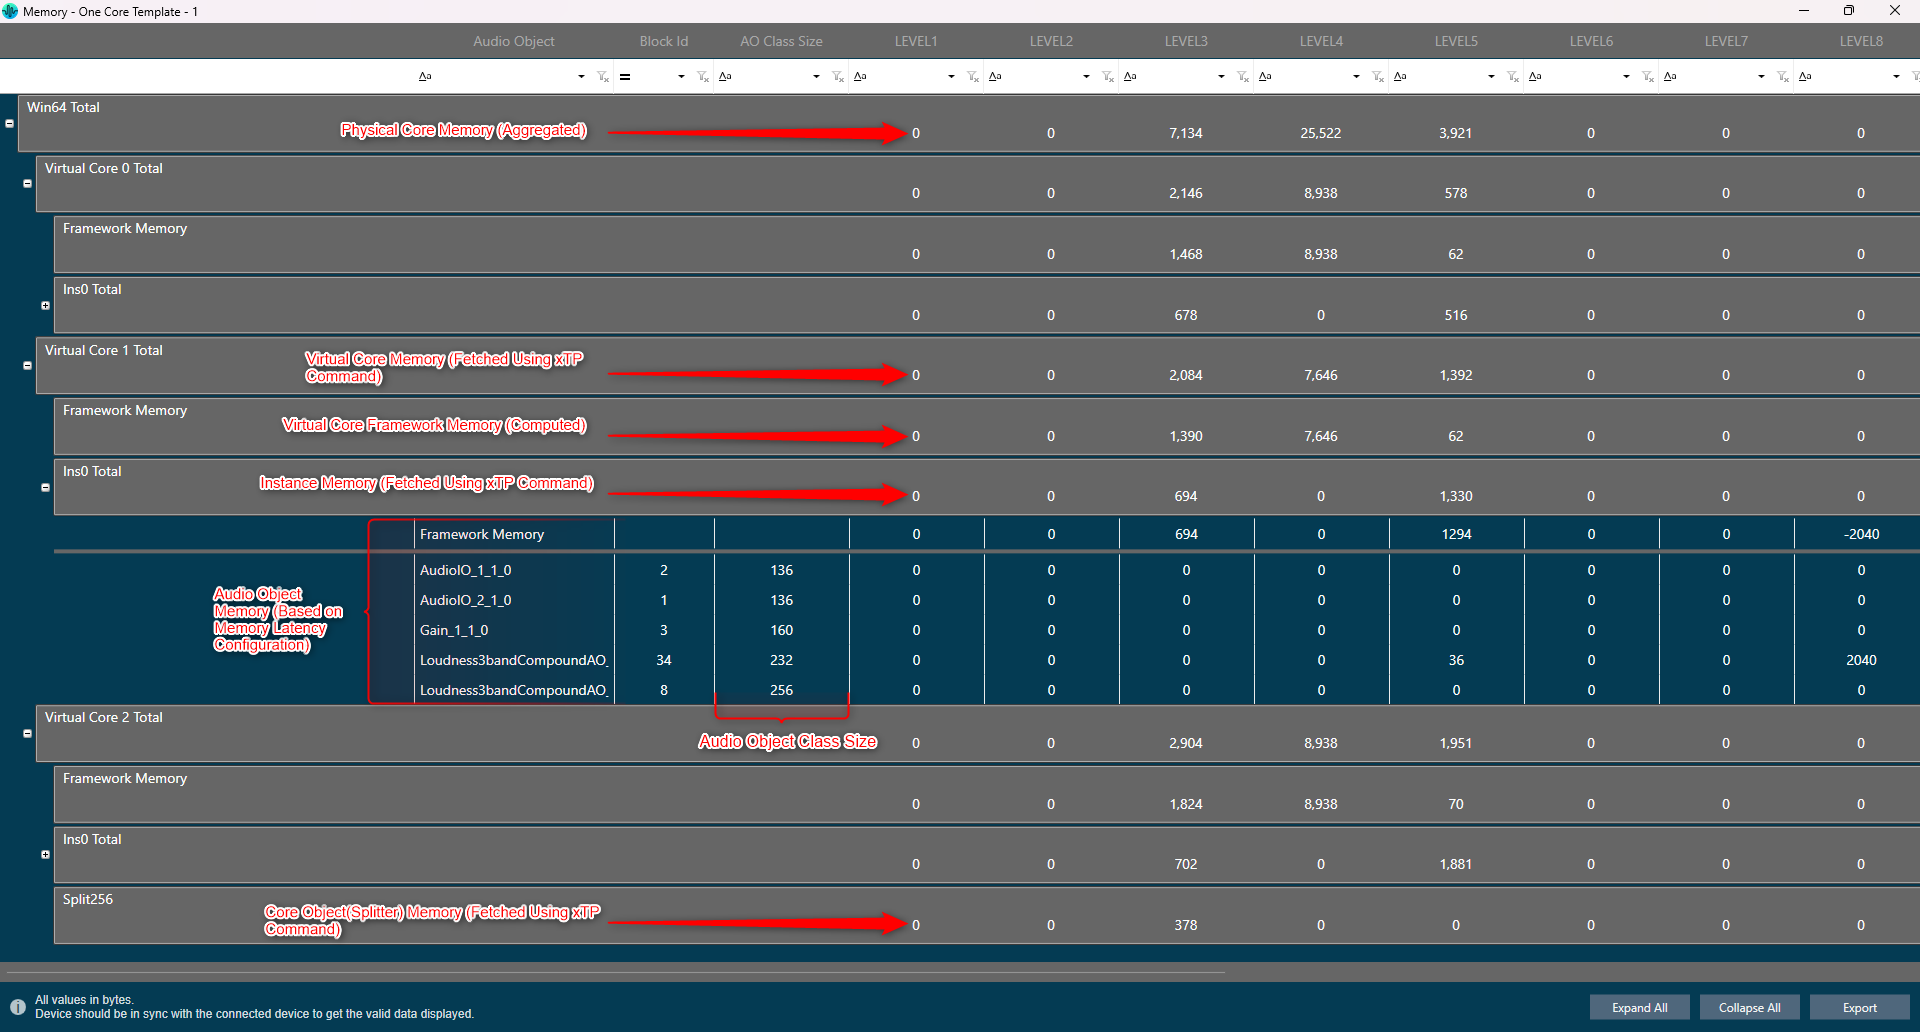
The Memory window presents the CPU memory of cores, core objects and audio objects of the device in a single multi-level grid.
Memory profiling data of cores and core object is fetched from the device (hardware) using xTP Commands, and the memory of the audio object is fetched based on its memory latency configurations.
Overhead Memory consumed by core and instance is calculated and displayed as ‘Framework Memory’. You can optimize signal flow or adjust latency based on this information.
Apart from memory profiling data, the class size of each audio object is also fetched from the device using xTP commands and displayed in the memory window from the X release(24.x.x.xxxx) audio library onwards.
Memory window is only enabled if the device xAF dll version is 18.x.x.xxx or higher.
Before starting the Memory window, the signal flow should be flashed.
If the memory latency configuration is updated, the signal flow should be flashed again and the memory window should be restarted.
Memory profiling data of non-xAF instance core objects (Buffer,Splitter…etc) is available only from the X release(24.x.x.xxxx) audio library onwards.
Launch Memory Profiling
Steps to launch Memory profiling:
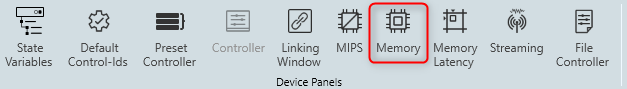
- Select the device node and click Memory. This opens the Memory window for the selected device.
When the Memory window opens, it will show a collapsible grid with core, instance, and audio objects.
- The physical core memory values displayed are the sum of its virtual cores.
- xTP Commands retrieve virtual core and core object memory from the device.
- Memory latency configurations are used to fetch audio-object memory.
- Overhead Memory consumed by the core and instance is calculated and displayed as ‘Framework Memory’.
- xTP Commands are used to retrieve audio object class size based on the block ID of the audio object.
- Expand All: Expands all rows of the collapsible grid.
- Collapse All: Collapses all rows of the collapsible grid.
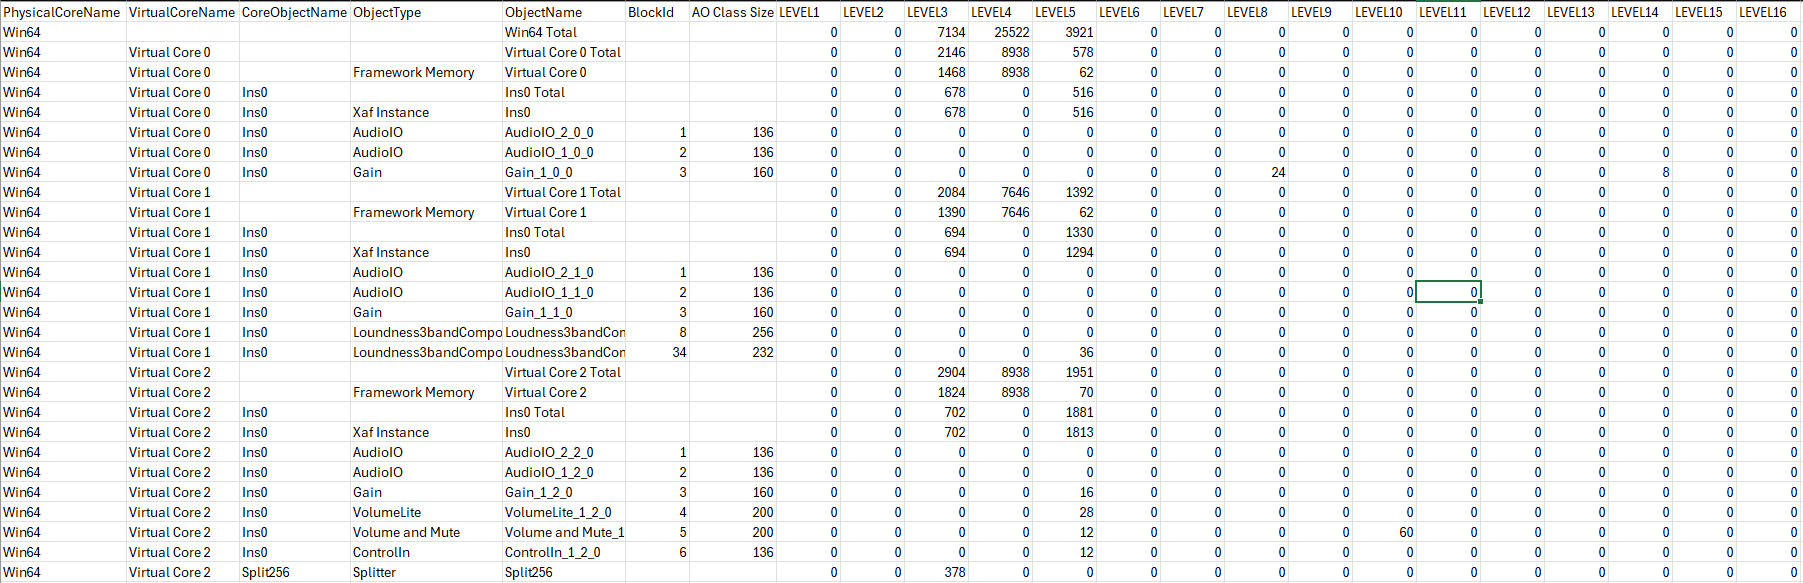
- Export to CSV: Click on the Export option to export the memory data of the device in a CSV file. The exported file will have a row for Framework Memory for Virtual core, Instance, Audio Objects, and Physical core along with columns PhysicalCoreName, VirtualCoreName, CoreObjectName, ObjectType, ObjectName, BlockId, AO Class Size and Level1 to Level 16 as per the below image.