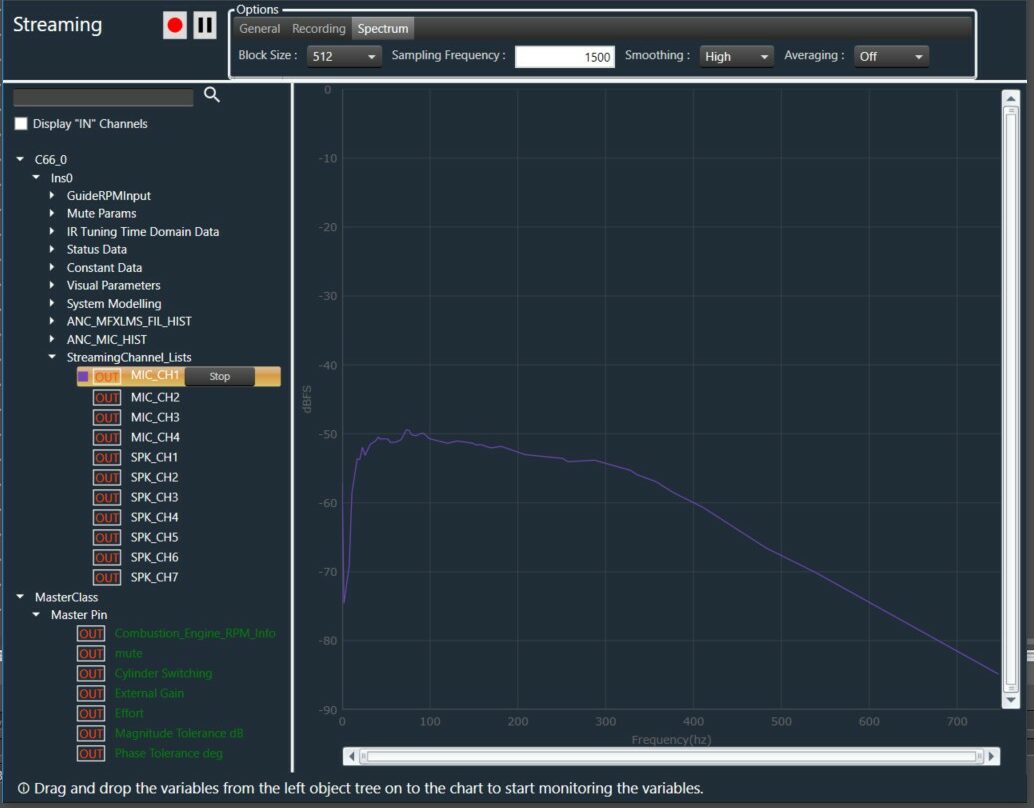
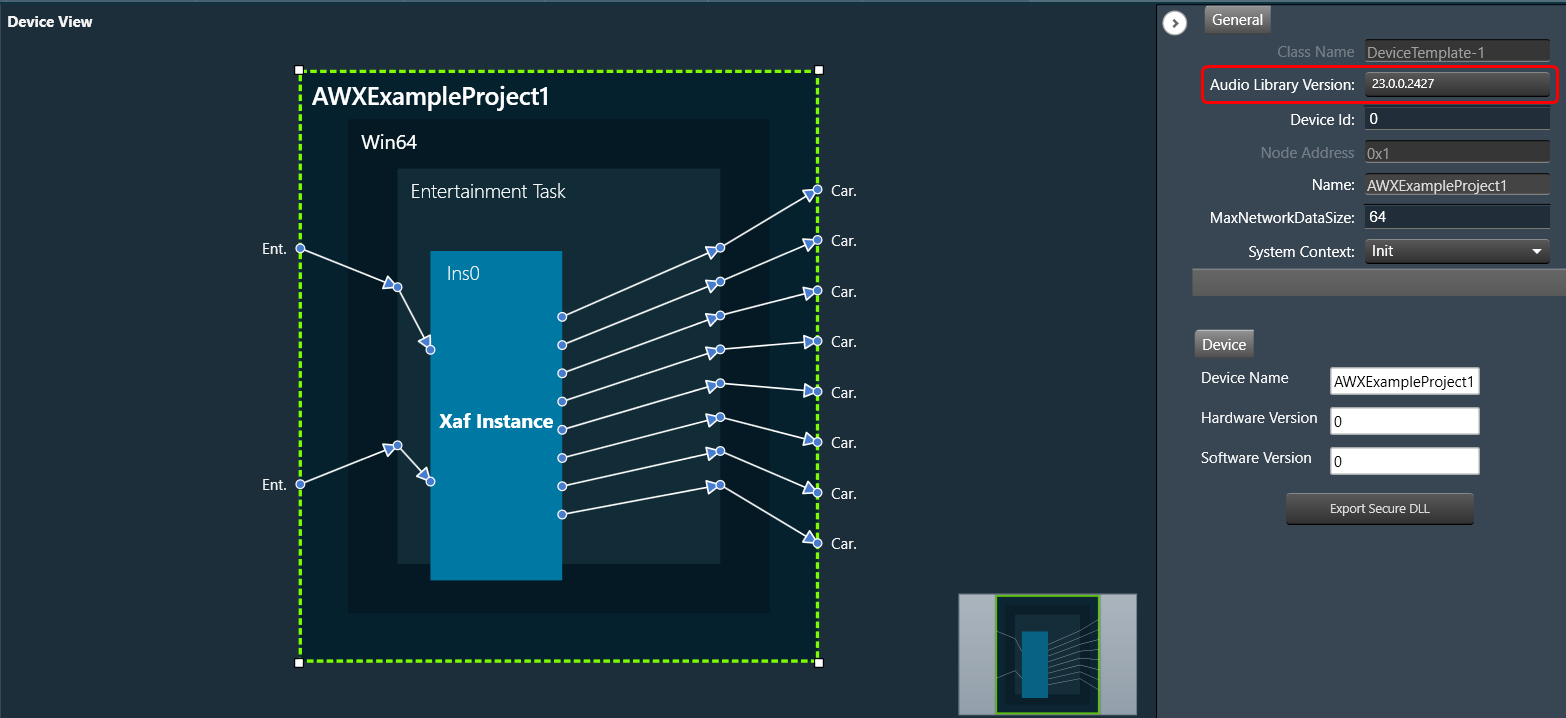
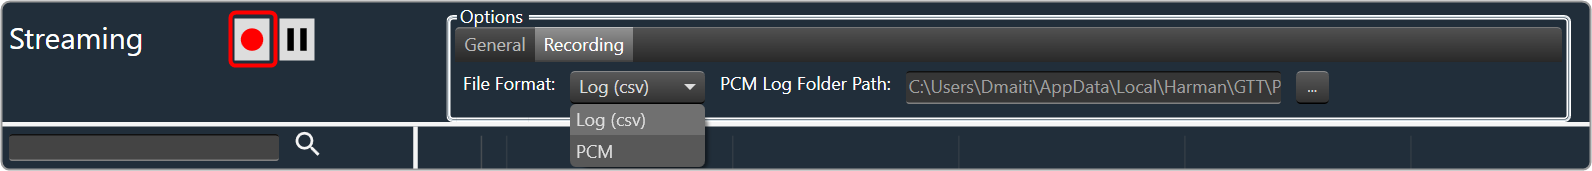
The streaming data can be recorded and stored in a file using the record button available. There are two supported file formats.
- Csv file format (.log)
- PCM file format (.pcm)
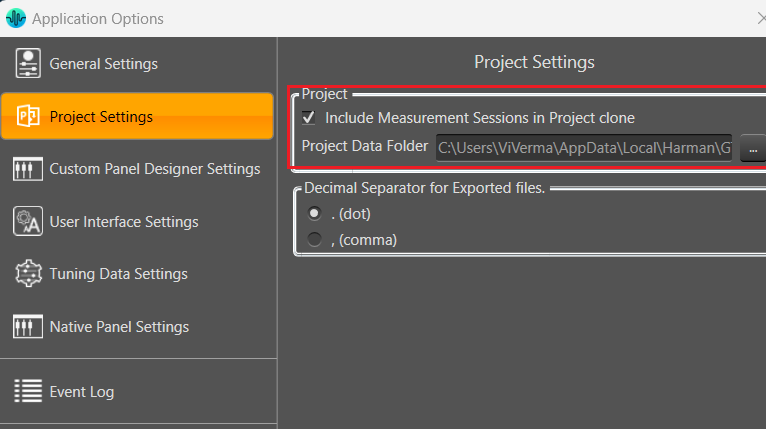
The default recording folder is C:UsersUsernameAppDataLocalHarmanGTTPCMStreamingLogs. To change the folder location for the recording, you need to click on “…” button.
Record Streaming Data in csv format
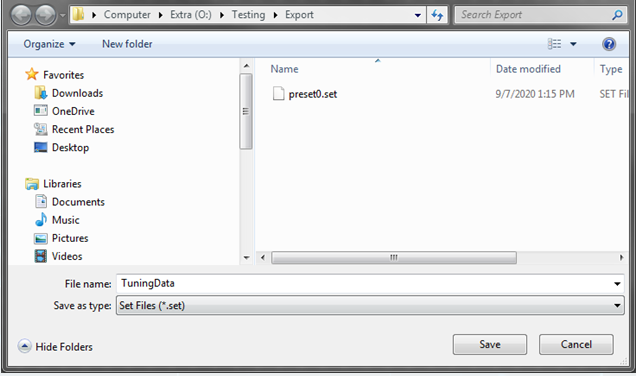
The csv format logs are supported by both polling and streaming state variables. Once you click on the record button, it opens file explorer to choose the location and file name for storing streaming data.
The default file format for storing streaming recordings is CSV.

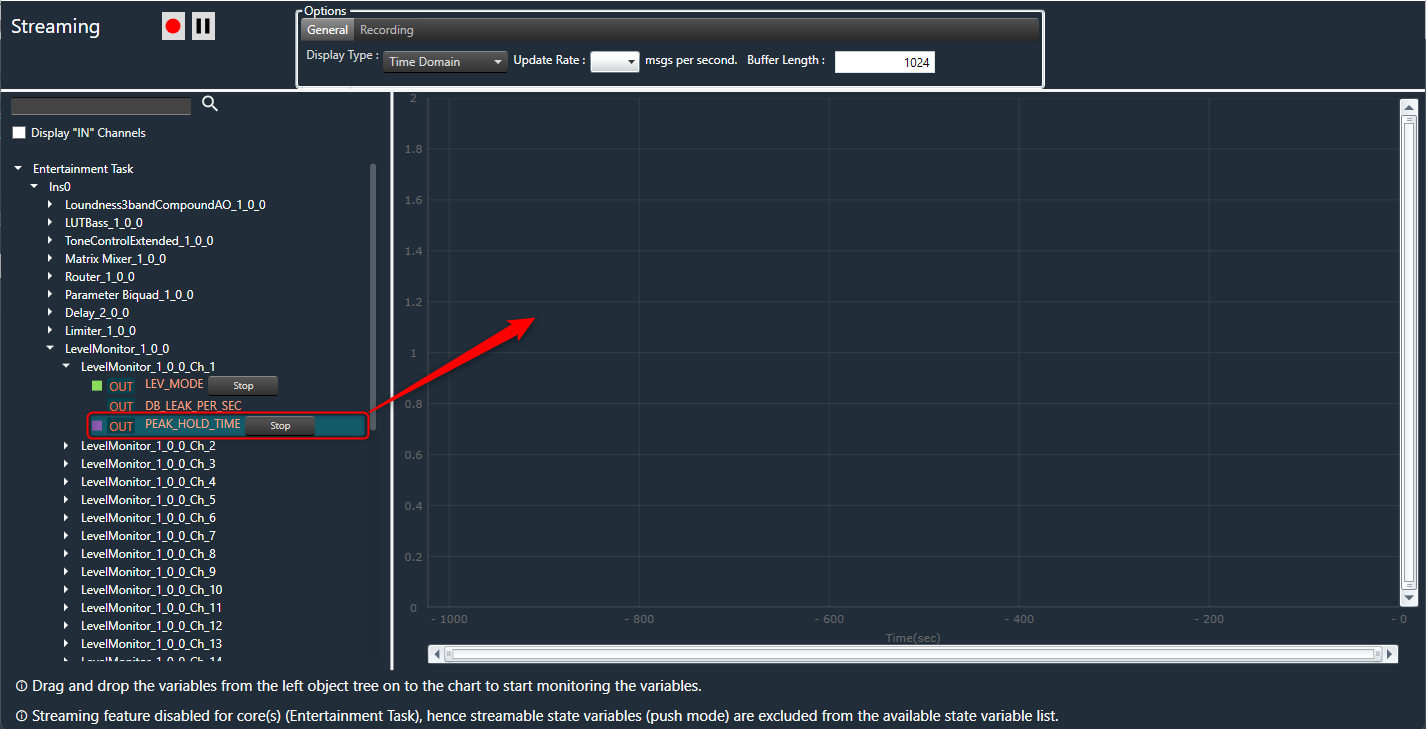
The recording process is indicated by a continuously blinking button, indicating that streaming is currently being recorded. To stop the recording, simply use the same button.
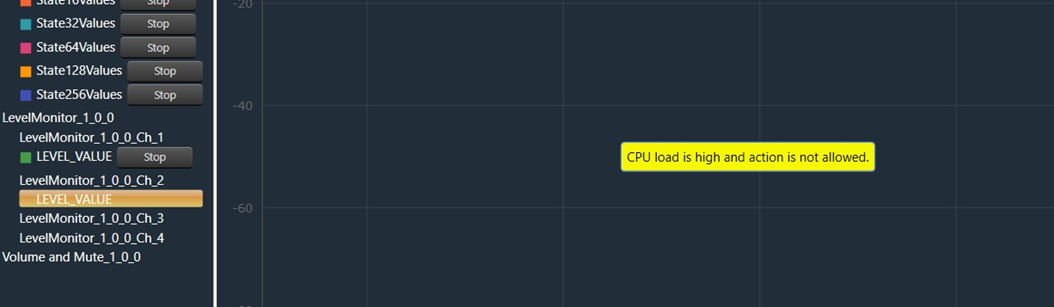
During the recording process, adding or stopping streaming is not permitted.
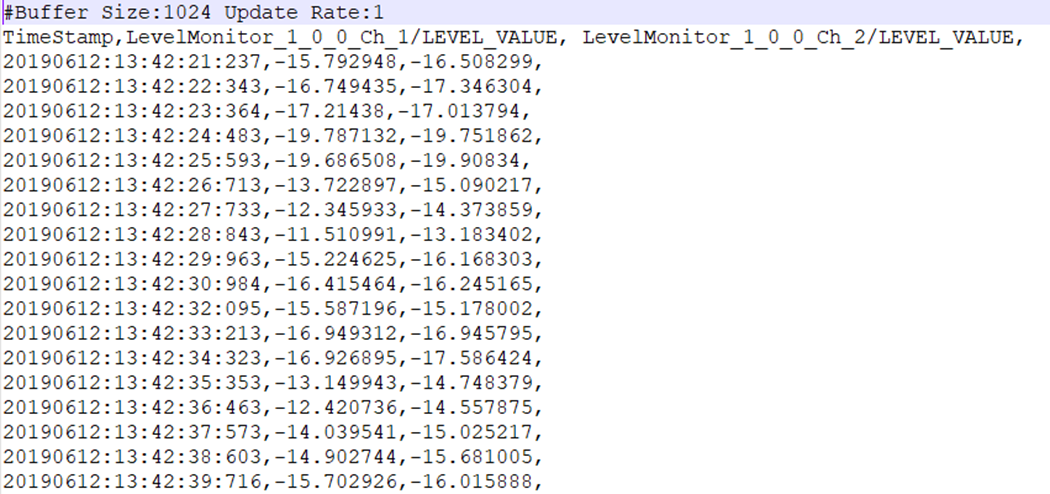
The file stores the following information in the streaming data:
- Buffer Size and Update Rate.
- Streaming variables names with comma (,) separator.
- Streaming variable data with comma (,) separator and if any variables have an array of data it is separated by spaces.
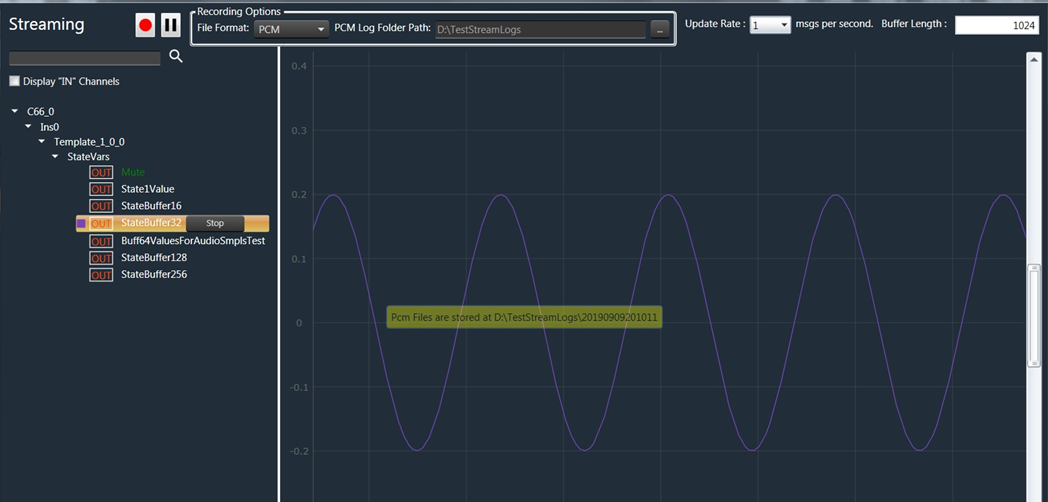
Record Streaming Data in PCM format
The PCM format recording only supported by streaming state variable. Once you click on the record button, it opens file explorer to choose the location and file name for storing streaming data.
Prior to commencing PCM format recording, you must ensure the following conditions are met:
- The State Variable used for streaming is of a streamable type.
- PCM format is selected as the file format.

The recording process is indicated by a continuously blinking button, an indication that streaming is currently being recorded. To stop the recording, simply use the same button.
During the recording process, adding or stopping streaming is not permitted.
Each state variable’s streaming data is stored in a separate file containing raw data, which can be imported into tools such as Audacity for further analysis or processing.
A date-time stamped folder is automatically created for each recording under the root folder. Inside this folder, a separate file is generated for each state variable being streamed.
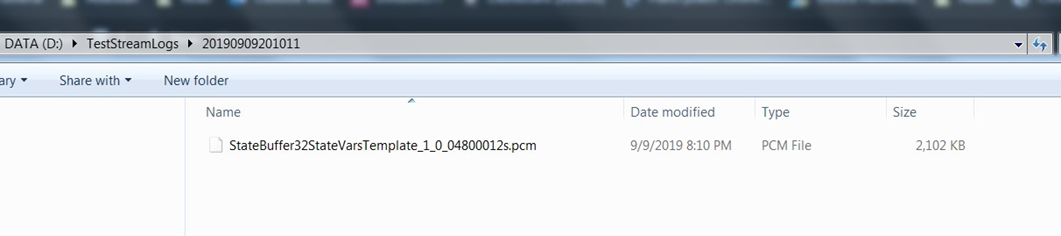
File Name Format: {state variable Name} {Channel Name} {Audio Object Name} {sample rate} {duration in seconds}. pcm
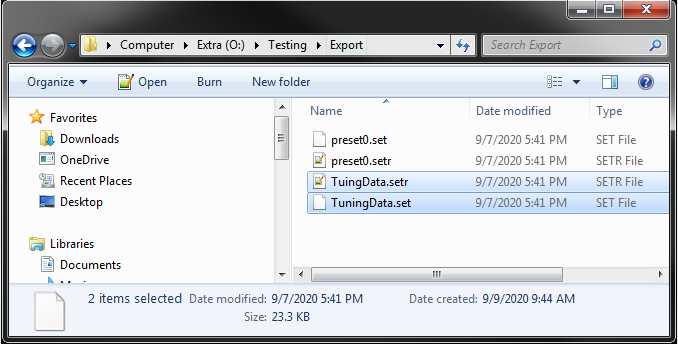
Example of sample recorded file.
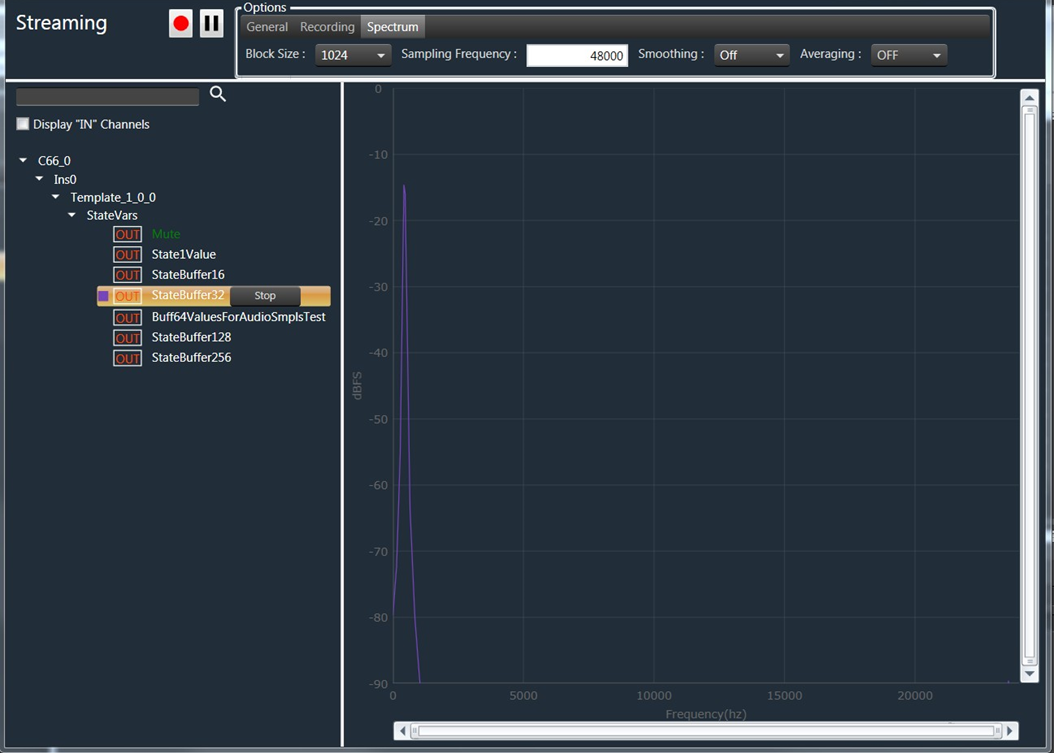
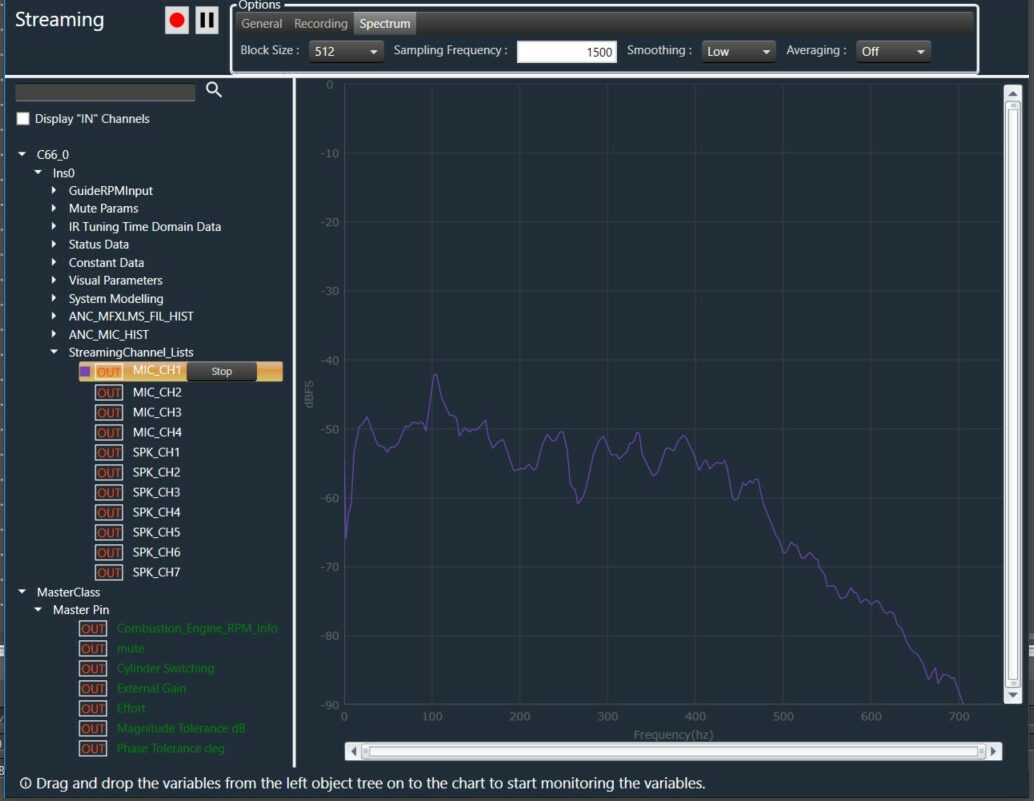
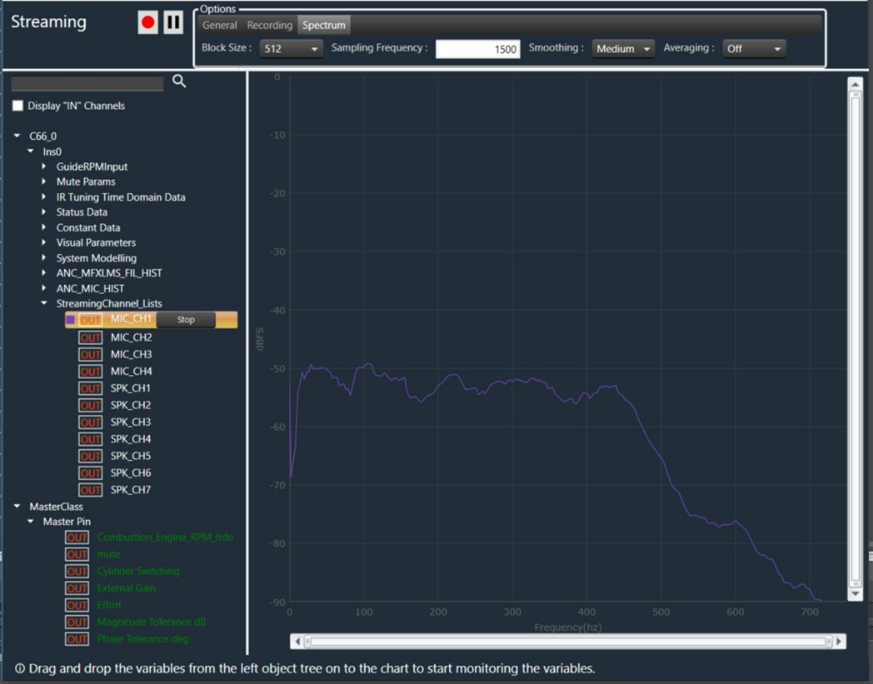
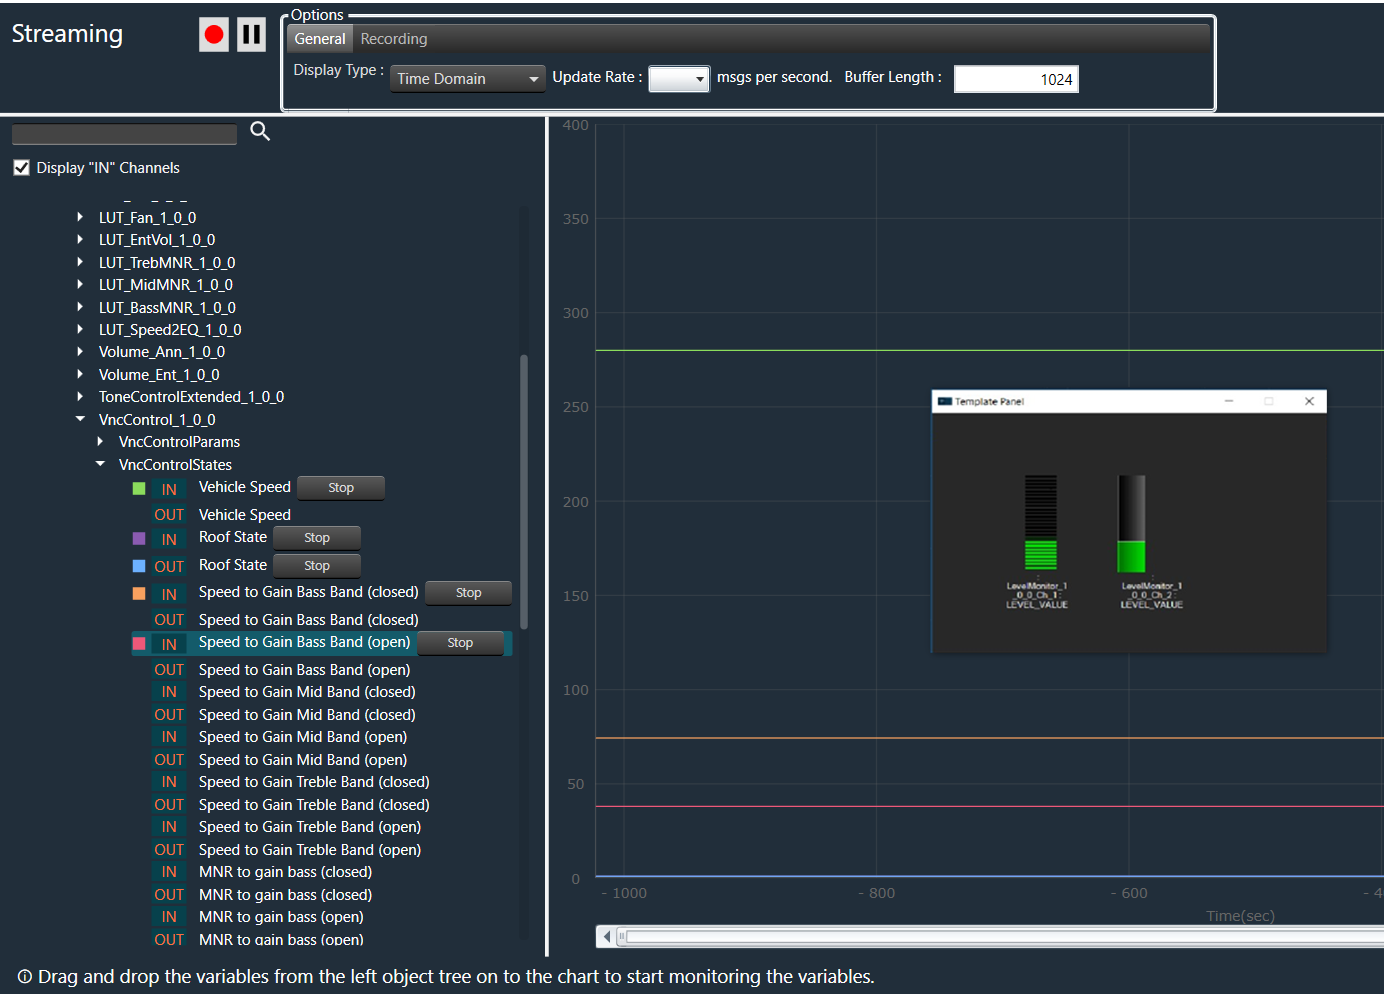
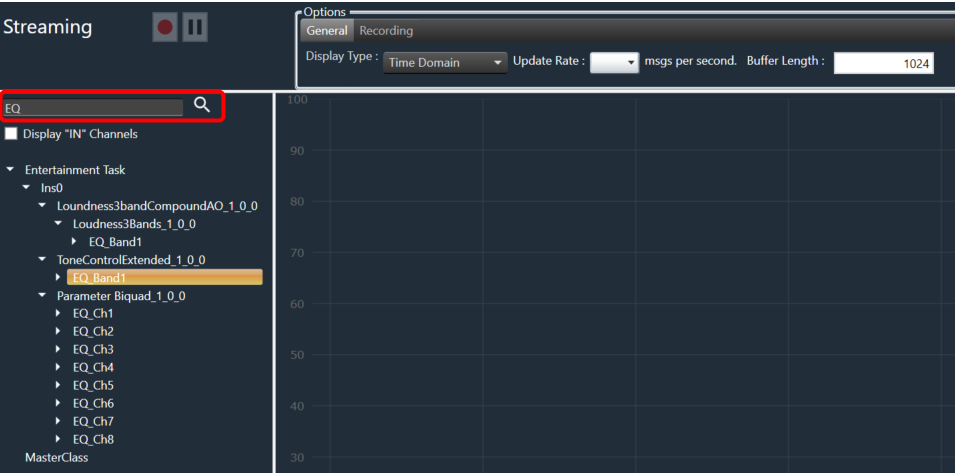
Pause and Play Streaming
The streaming data can be paused by using the pause button. When the stream is paused, it indicates that GTT Tool stops receiving data from the device internally, and no bandwidth is utilized during this pause period.

To resume streaming, the same button can be used, and it will convert to a play button once data is paused.
It is not permitted to add new state variables or change the update rate while the streaming is paused. However, stopping an active state variable is allowed.