The Waterfall Graph is a visual representation used to analyze and interpret the frequency content of a WAV file or any other signal data. This graphical representation provides a comprehensive view of the signal frequency distribution over time, allowing to identify patterns, anomalies, and trends that may not be evident in a traditional time-domain or frequency-domain plot.
You can easily identify dominant frequencies, harmonics, and noise within the signal. The intensity and color of each frequency component indicate its amplitude and presence within the signal, respectively.
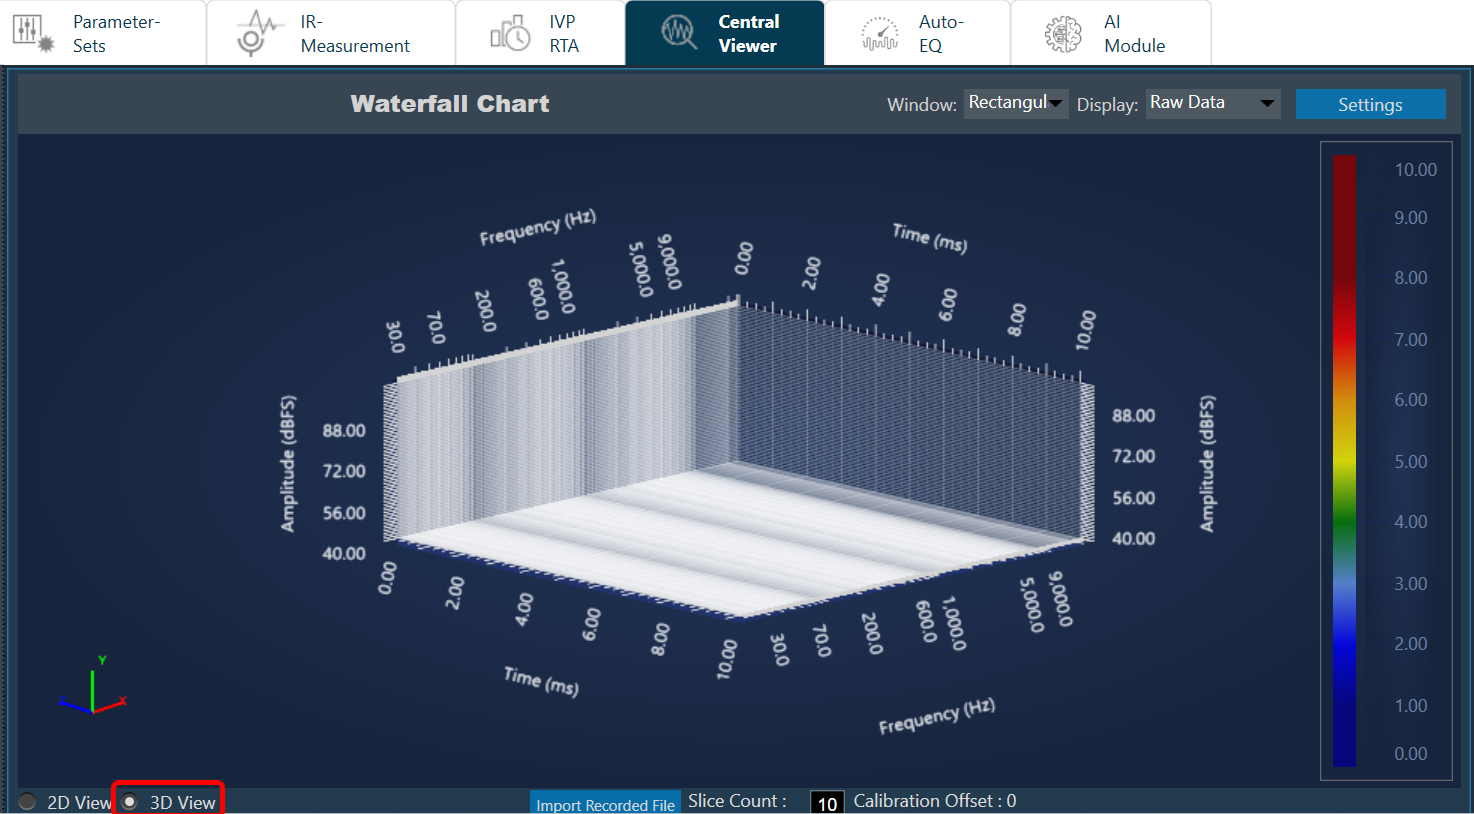
On the Central Viewer window, you can switch to 3D view of the plot. On the 3D view, you can see the waterfall chart.
Import Recorded File: Click “Import Recorded File” to import .wav audio files directly onto the chart.
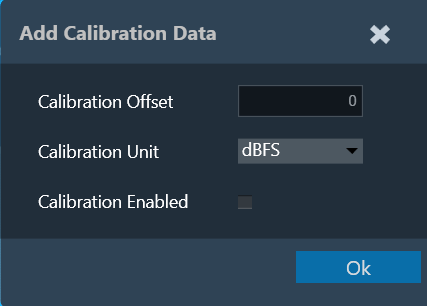
Customize Calibration Data: You can adjust the calibration offset, measurement unit, and enable/disable flags for the recorded files. On entering the calibration details, corresponding values will be applied to the chart.
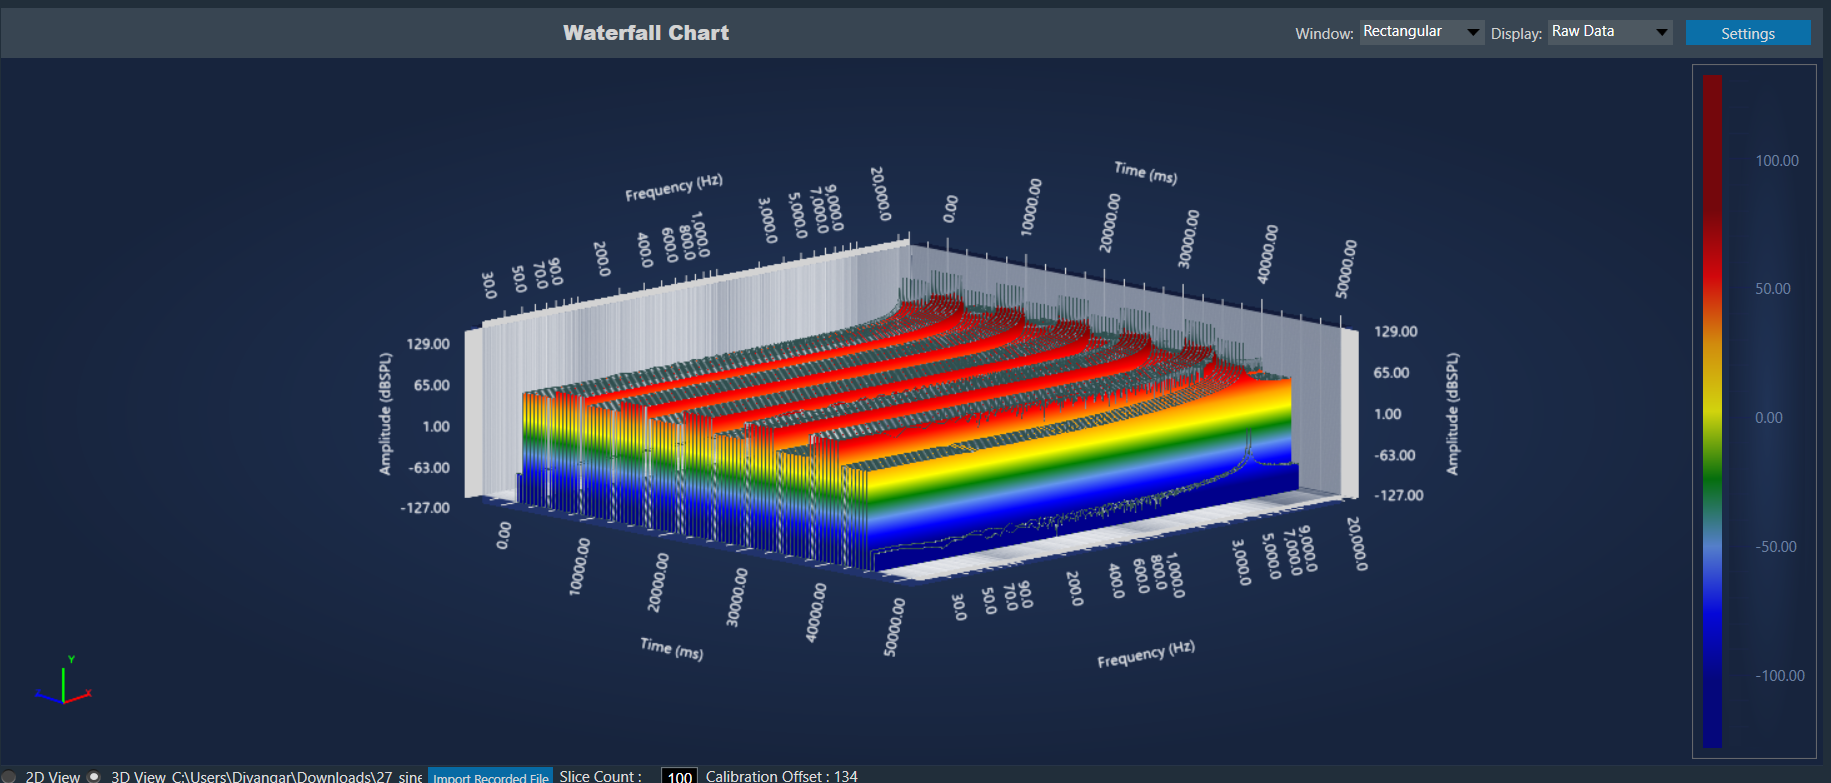
Chart Details
- Axis Details: X axis represents the frequency, Y axis represents the amplitude, and Z axis represents time.
- Calibration offset is displayed at the bottom for reference.
- A legend represents the energy levels of the graph.
- Customization Options: Apply different Window and Display options to customize the graph appearance.
- Zoom and Rotate: Explore the data in detail with mouse scroll, pinch-to-zoom, and 360-degree rotation capabilities.
- Slice Control: Choose the number of slices (10-100) to segment the graph for analysis.
- The selected .wav file and settings are saved and retrieved within the project.
IR measurement plot
It is possible to view IR measurement also in 3D view. Any mic and speaker selection plot will be displayed in waterfall plot.
At any point of time only one signal can be viewed. Multiple mode is not applicable for 3D plot.
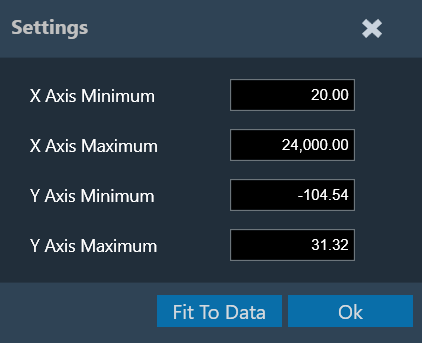
Settings:
It is possible to change the X and Y axes range of the graph. “Fit To Data” will consider the min and max values of X and Y range. However, there is a known limitation of cropping in while using the settings.
Limitations
- It is not possible to view both IR and imported file plot at same time. Graph always shows latest selected option.
- It is not possible to delete or clear the plot. Workaround is to import new file again.
- dBFS unit is by default. Since it is not possible to add calibration with this unit, this unit will be removed in future.
Known behavior
There are a couple of specific behaviors in the 3D view that deviate from expectations. These require a fix from the third-party.
- If scale is changed, graph is not clipped.
- Mouse hover is not exactly pointing to peak.