Ensure that the following requirements are met before beginning the streaming process.
- Make sure the device is connected to GTT.
- If you want to stream streamable state variable, then you can enable Streaming option, for more details refer Streaming.
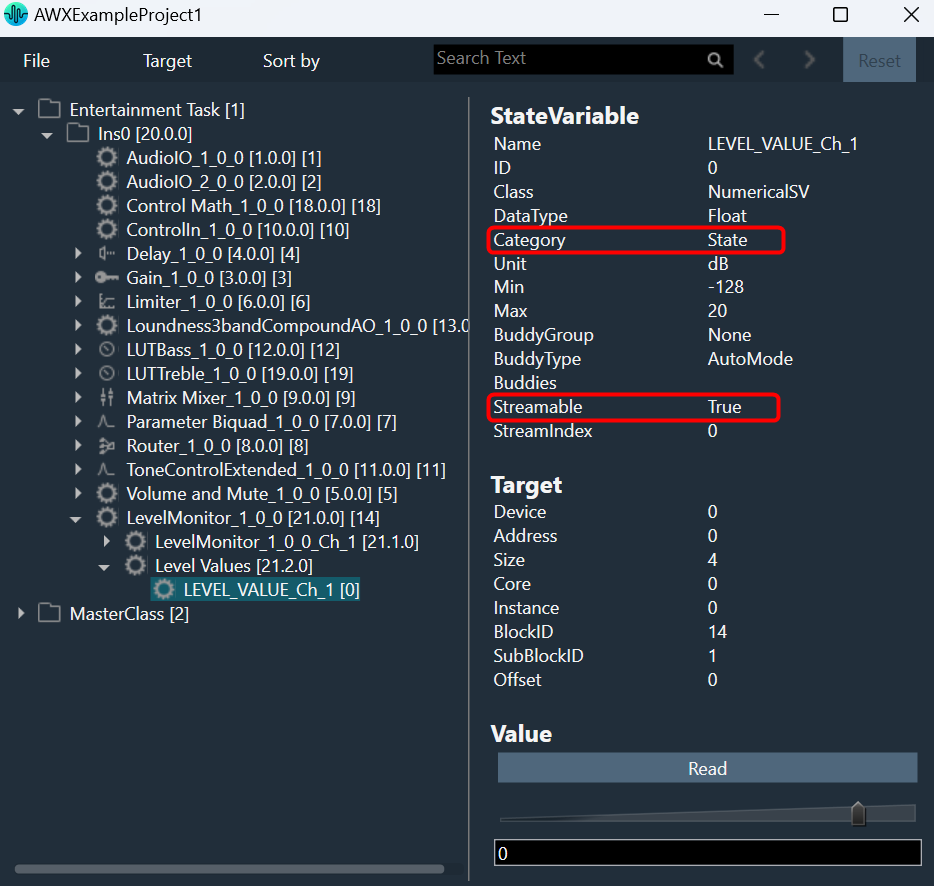
- While performing streaming make sure the parameter supports streaming. You can verify this by opening the state variable explorer and confirming that the “Category” is set to “state” and “Streamable” is set to “true” for the parameter.

To start live streaming, follow the below steps:
- Open GTT project, click on the Streaming option from the Device Designer tab. This opens the streaming window.
- On the General option, set the Display Type, Update Rate, and Buffer Length.
The Update Rate will be applied to all live streams, and Buffer length (the maximum streaming data that can be stored) can be changed any time during the live streaming.

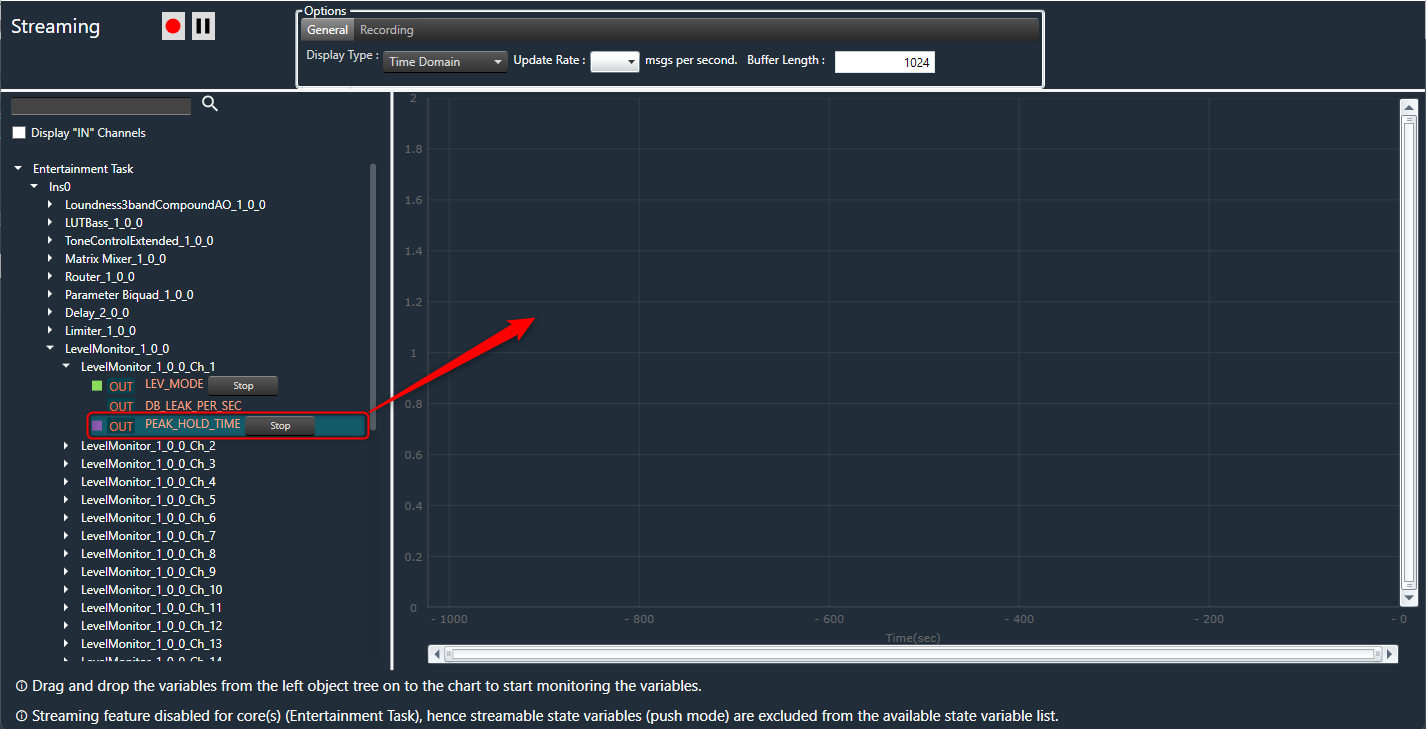
- Expand the state variable you want to stream and drag-drop the variable from the object tree to graph. This starts live streaming of the variable.
Active streams can be matched with the curve on graph by the colors of the curve and the rectangular block next to the state variable.

The graph can be zoomed on both the x and y axes by scrolling. - Click on the Stop option, if you want to stop streaming of the variable.
You can open multiple streaming windows for a device and stream on multiple devices. However state variable can be streamed in only one window at a time and not in multiple window.
If the “Streaming” feature is disabled for any core, streamable state variables (push mode) will be excluded from the available state variable list for that core.
Viewing Streaming Data in Custom Panel
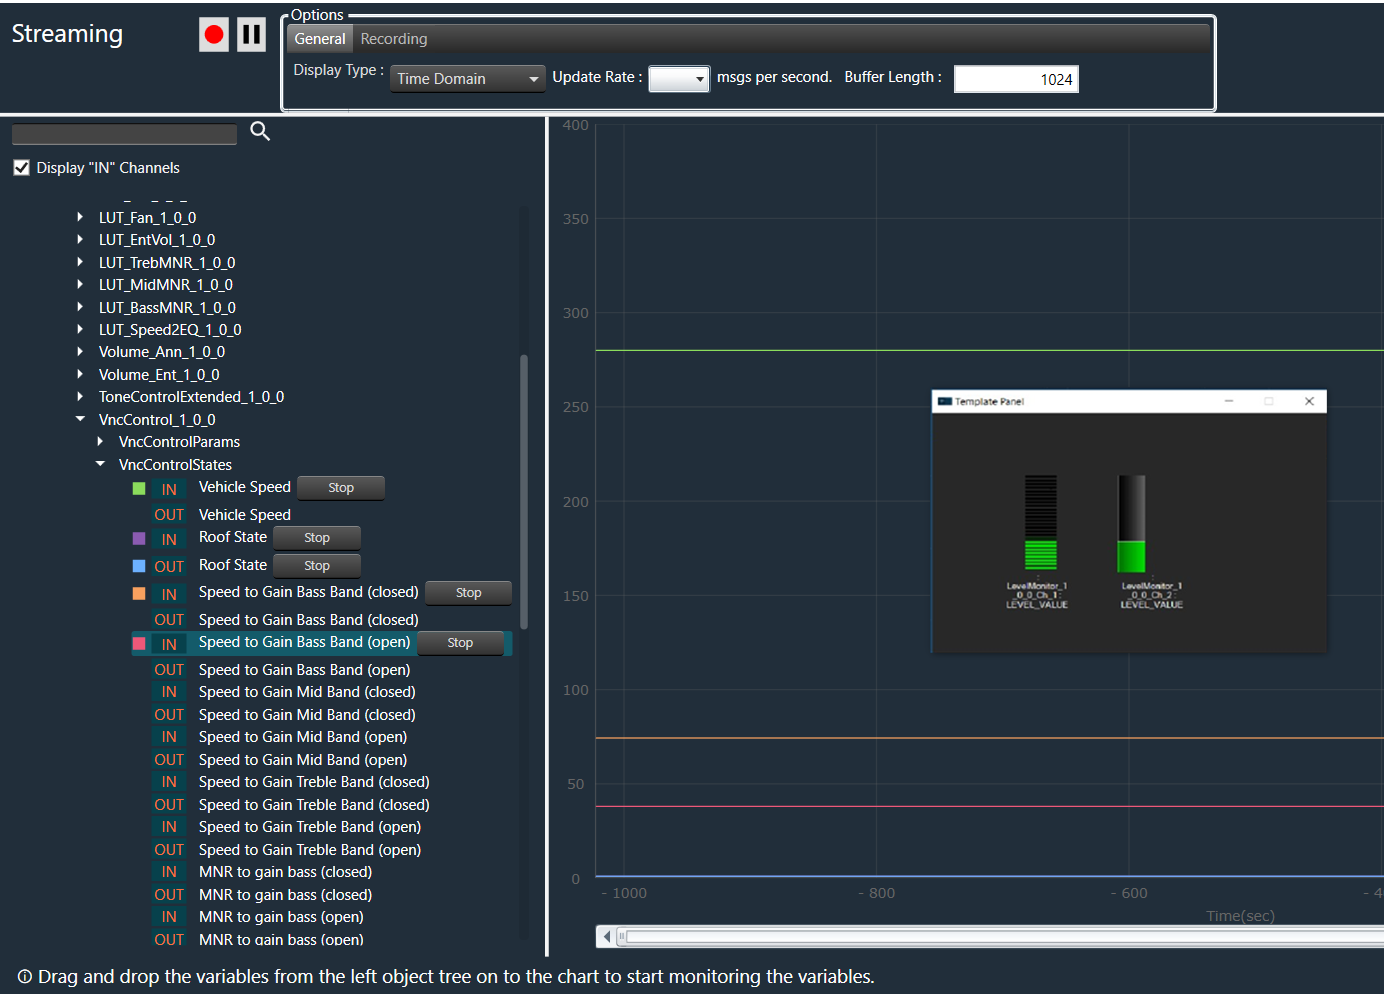
You can view live streaming data in a custom panel. Map the streaming state variable address to any control on the custom panel and start the live streaming from the streaming window. Then, launch the custom control panel.
The live streaming of the state variable will be displayed on a custom panel.
Only the current value of the state variable will be displayed on the custom panel.

Search Variable
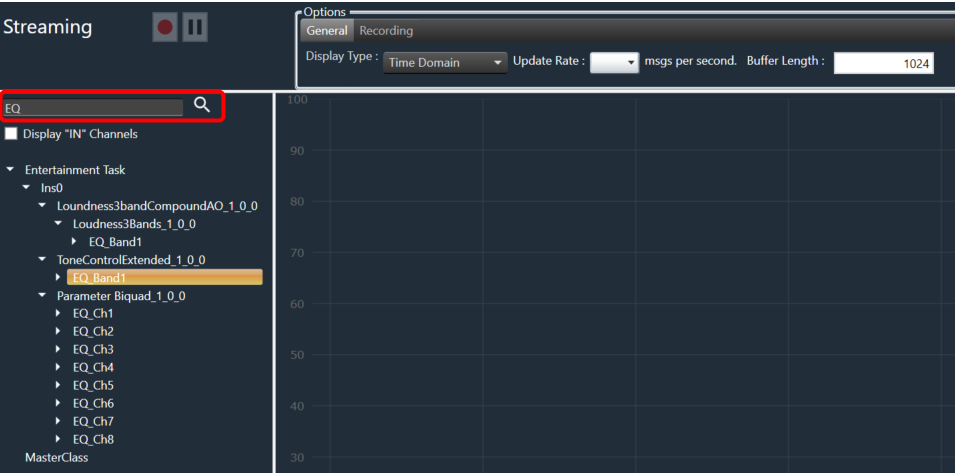
You can search for a specific variable from the object tree in the Streaming window and then drag and drop it onto the chart.
To find a variable in the Streaming window, enter at least two keywords of the variable in the search bar. The GTT will use these keywords to search and display the filter results in the object tree.

Limitations in Streaming
Below are the limitations associated with streaming.
- Last selected update rate will be applied to all active streams.
- The update rate is not configurable, you need to select one of the predefined values from the drop-down menu. It is not possible to enter a custom update rate.
- Maximum buffer length allowed is 65536.
- Streaming state variables are read only.
- Zooming the graph with more than 8 active streams in parallel may cause performance issues.
Opening multiple streaming windows may result in increased CPU load, potentially leading to performance issues. To avoid such concerns, you can configure the option to receive notifications and restrict streaming when CPU load exceeds a certain threshold.
By default, the maximum allowed CPU load is set to 100%. However, you can configure restrictions at specific load levels by modifying the “MaxAllowedCpuLoadForMonitoring” value in the configuration file.


