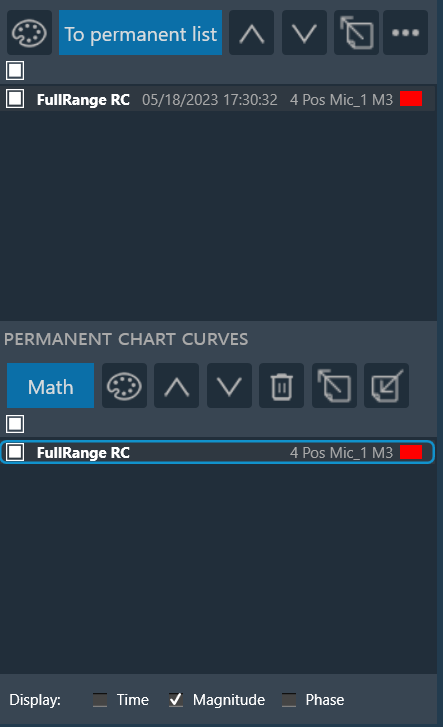
Every curve displayed in a graph is referenced by an entry in either the browsing or the permanent curve list.
A curve list entry consists of following components:
- Parent configuration of the curve.
- Speaker name of the curve.
- Microphone name of the curve.
- Color of the curve.
- Checkbox for show or hide the curve.
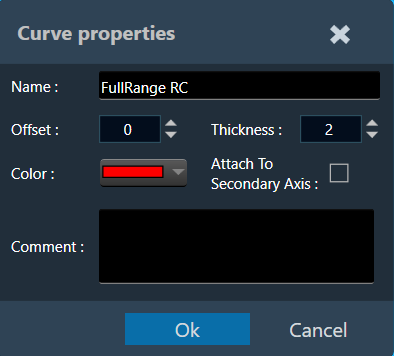
You can change the following curve properties of an entry:
- Change the name.
- Change curve thickness.
- Change offset.
- Change the color.
- Attach curve to secondary axis (right axis).
- Add comment for trace. The provided comment will be exported and imported along with curve.
- Shows the associated math operation (in the case of math curves).
Double-click on the entry to open curve properties dialog box, perform the respective change, and click ok.
The curve name is not editable if the average is calculated with a cross-mic array.
Browsing List
The browsing list holds entries for all curves that are directly linked to elements currently selected on the scene.

The curves will immediately disappear once the respective elements on the scene are de-selected. It still remain in the same order if GTT re-open.
The browsing list toolbar offers the following options.
| Name | Icon | Description |
| Recolor All Curves | The recolor button assigns easily distinguishable colors to all curves present on the graph. | |
| To permanent list | Sends the highlighted curve from the browsing list to the permanent list, detaching it from the scene selection | |
| Move Curve Up |  |
To move the highlighted curve up in the list. |
| Move Curve Down |  |
To move the highlighted curve down in the list. |
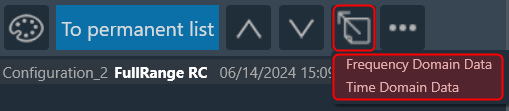
| Export Curve | Using the export option you can send two type of data.
Based on the selection, GTT will export the trace data (frequency-magnitude-phase or time-amplitude) into a text file. |
|
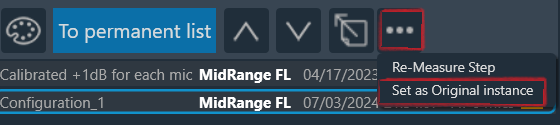
| More Options (…) | 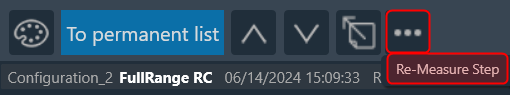
Re-Measure Step: Once completing the initial measurements and conducting a thorough analysis of the acquired data in the Central Viewer, it may be identified that re-acquisition is necessary for certain speakers due to changes in hardware setup or tuning data. In such cases, GTT provides an option to re-acquire specific steps, allowing for the overwrite or appending of new measurements to the existing session. To utilize this feature:
The Re-Measure Step feature provides flexibility and precision in managing measurement data, enabling to adapt to changes in hardware setup or tuning data effectively. The Re-Measure step is possible only if one Mic array is selected on car view.
Set as Original Instance: When we perform a re-measure with the append option, multiple measurements can be available for a single speaker. In this case, the user can select a particular measurement instance (browsing curve) and mark it as the ‘Original instance.’ This means that when averaging mics across the mic array, only the mic array instances marked as original will be considered. This option is available other than ‘Average’ Mic selection mode. To remeasure Mannequin measurements, GTT will look for the MQTT broker address, which the user needs to provide. |
Permanent List
The permanent list holds curves that are manually sent from the browsing list and the results of math operations. Curves in this list are detached from the scene selection and kept in the same order, until they are manually deleted.

The permanent list toolbar offers the following options.
| Name | Icon | Description |
| Math | Opens the math operations dialog. Any math result will be stored in the permanent list | |
| Recolor All Curves | The recolor button assigns easily distinguishable colors to all curves present on the graph. | |
| Move Curve Up | |
To move the highlighted curve up in the list. |
| Move Curve Down | |
To move the highlighted curve down in the list. |
| Move Curve Down | Remove highlighted curve from the permanent list | |
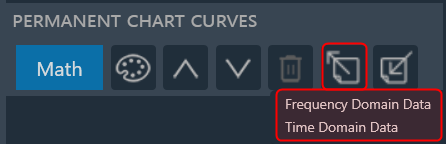
| Export Curve | Using the export option you can send two type of data.
Based on the selection, GTT will export the trace data (frequency-magnitude-phase or time-amplitude) into a text file. |
|
| Import Curve | Using the import option you can import following type of data.
This feature facilitates you preform following comparison:
Additionally, using the imported files you can perform math operations and adjust graph settings such as smoothing. |
Math Operations
The math operation allows you to performing calculations on your curves. Clicking on the “Math” button opens a Mathematical Operation dialog box with various tabs, each offering a specific mathematical function.
The following math functions you can perform.
- Add: To add two or more signals.
- Subtract: To subtract of two signals.
- Multiply: To multiply frequency domain of two signals.
- Spectral Division: To divide frequency domain of two signals (to calculate frequency difference).
- Average: To calculate average frequency domain for magnitude and phase.
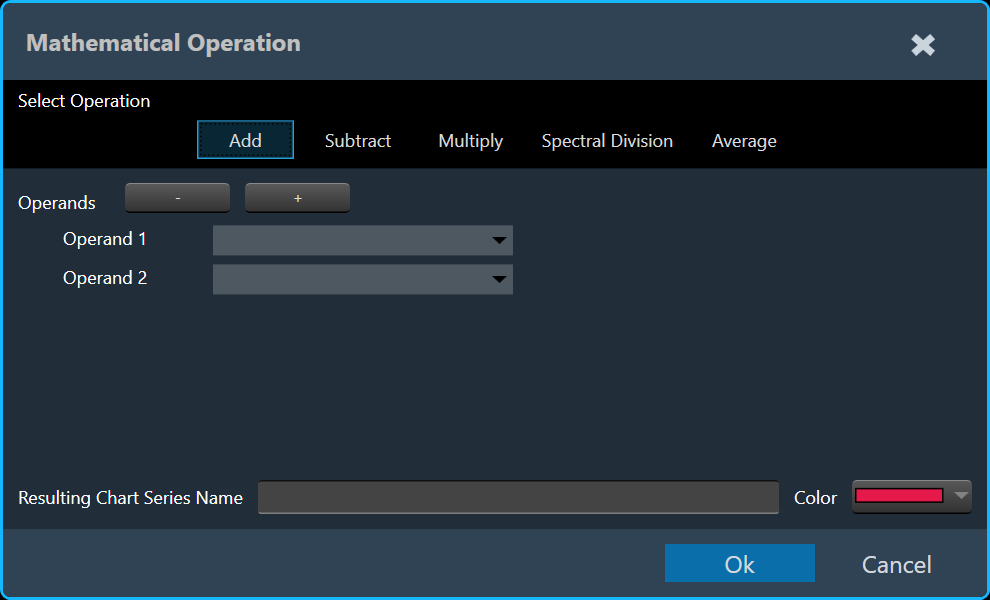
To illustrate combining curves, let’s explore the steps involved using the Add tab.
- On the Add tab, select Operand 1 and Operand 2 curve.
If required, add or delete an operand using + and – option. - Enter the Resulting Chart Series Name and select the color.
- Click Ok. The result of the curve added to the active chart.