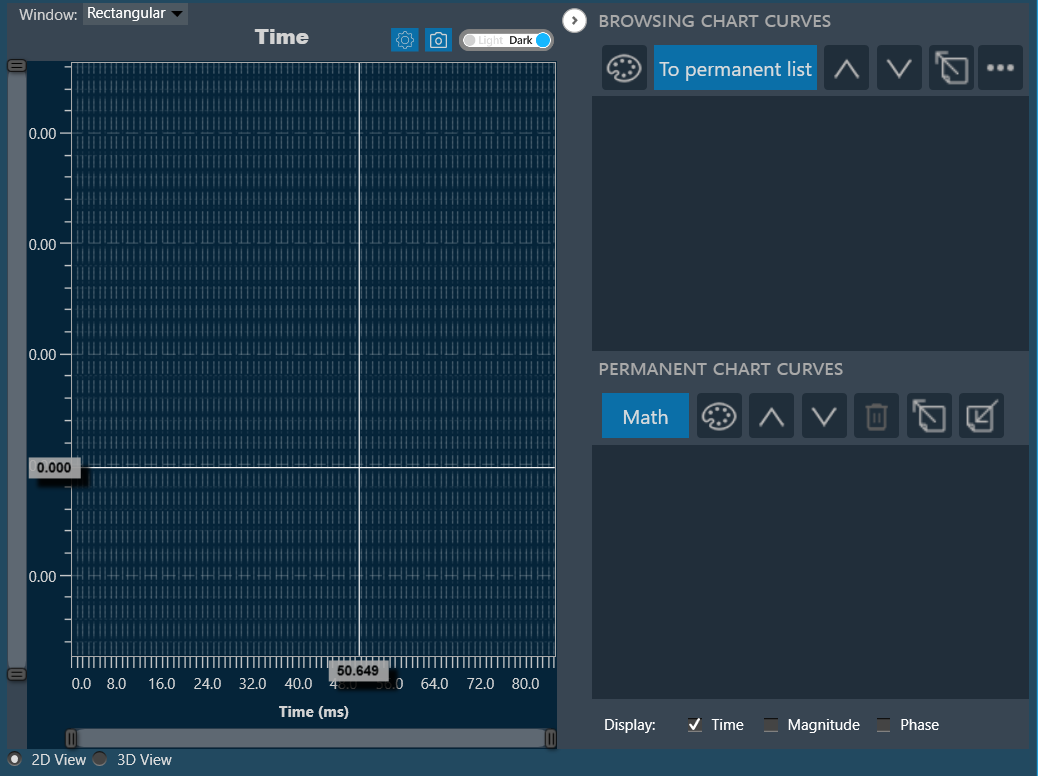
Data can either be displayed in the time (ms) domain or the frequency (Hz) domain. Using the display selector, you can choose the domain for any selected chart.

Display the time domain and restricts any other sub-plots.
Display the magnitude of the frequency domain and can be displayed with the phase data with it in sub-plots.
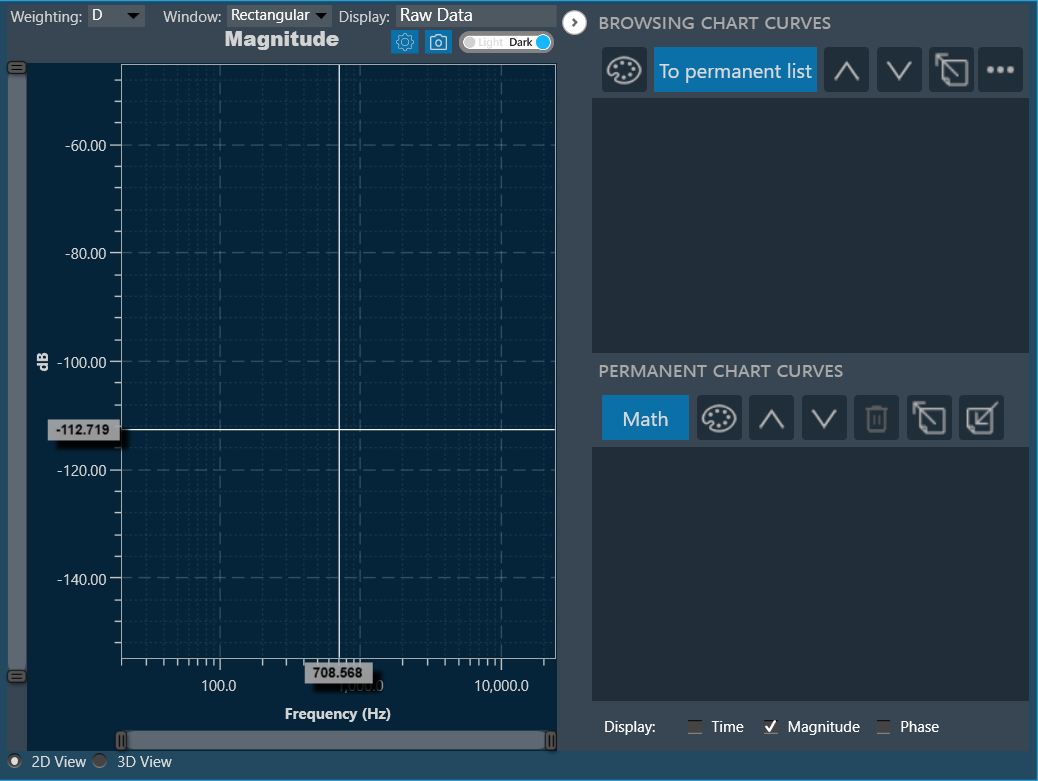
Using magnitude display option, you can set the display options for the respective graph.
Following are the available display options for magnitude graph.
- Raw Data: Display complete raw measurement data.
- Smoothed: Display data smoothed with a moving average of width [1, 1/3, 1/6, 1/12, 1/24, 1/48] octave.
- Octave Bands: Display data averaged in fixed octave bands of width [1, 1/3, 1/6, 1/12, 1/24, 1/48] octave.
Displays the phase of the frequency domain and can be displayed with the magnitude data with it in sub-plots.
