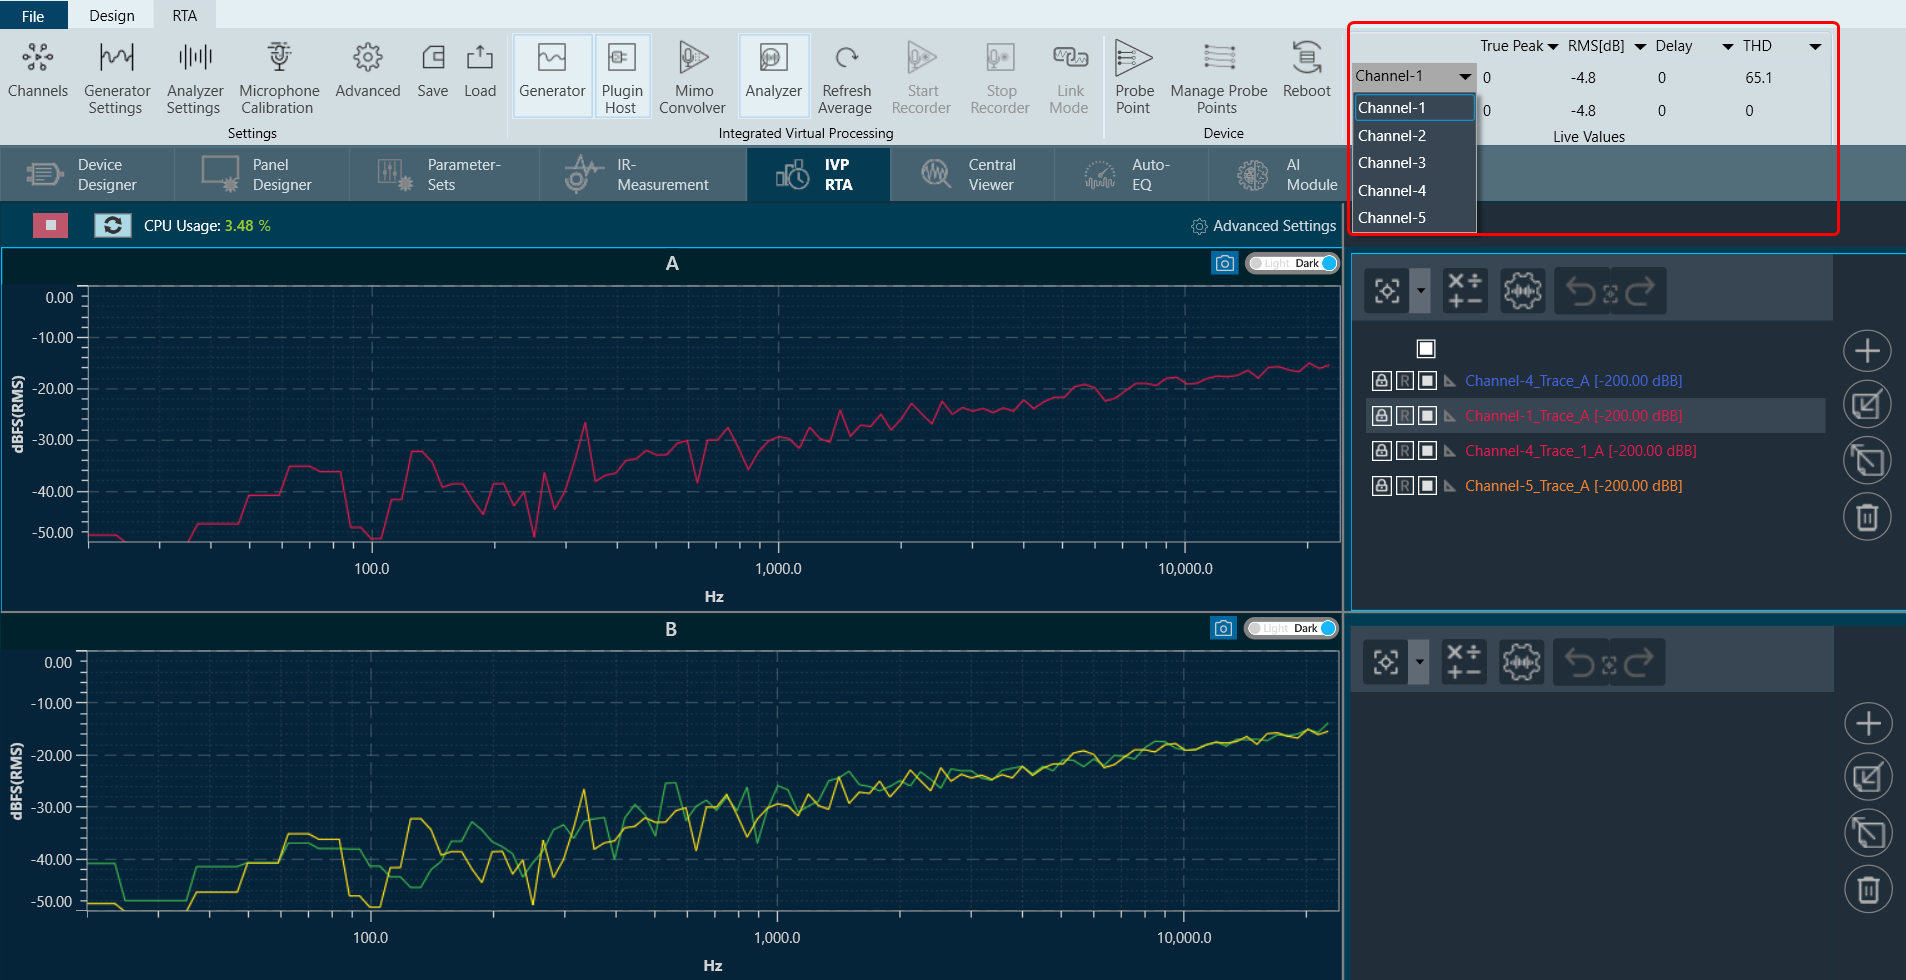
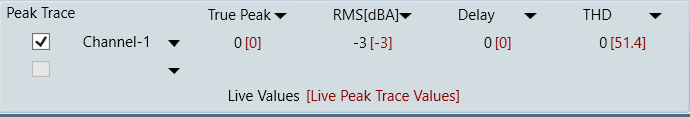
The ribbon bar provides a quick view of real-time measurements for RMS, THD, True Peak, Peak-Frequency, and THD+N. By default, the tool selects two channels for this display, and you can view the live data of two channels simultaneously. If you want to monitor a different channel, you can easily select it from the options available on the ribbon bar.
When using a average mode, it will load average channels by default; otherwise, it will pick the first channels that are listed on the analyzer.
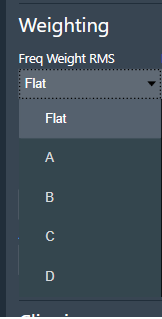
RMS Values will provide the selected weighting indication (A B C D).
The Weighting is displayed on the ribbon bar when configured in Advanced Settings. Go to Advanced Settings > Analyzer > Freq Weight RMS to activate weighting.
There are five live data columns available for selection:
- RMS
- THD
- True Peak
- Peak-Frequency
- THD+N
- Delay
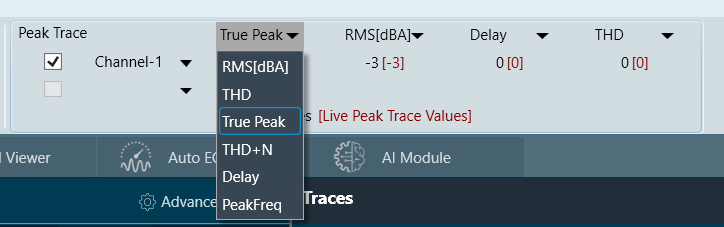
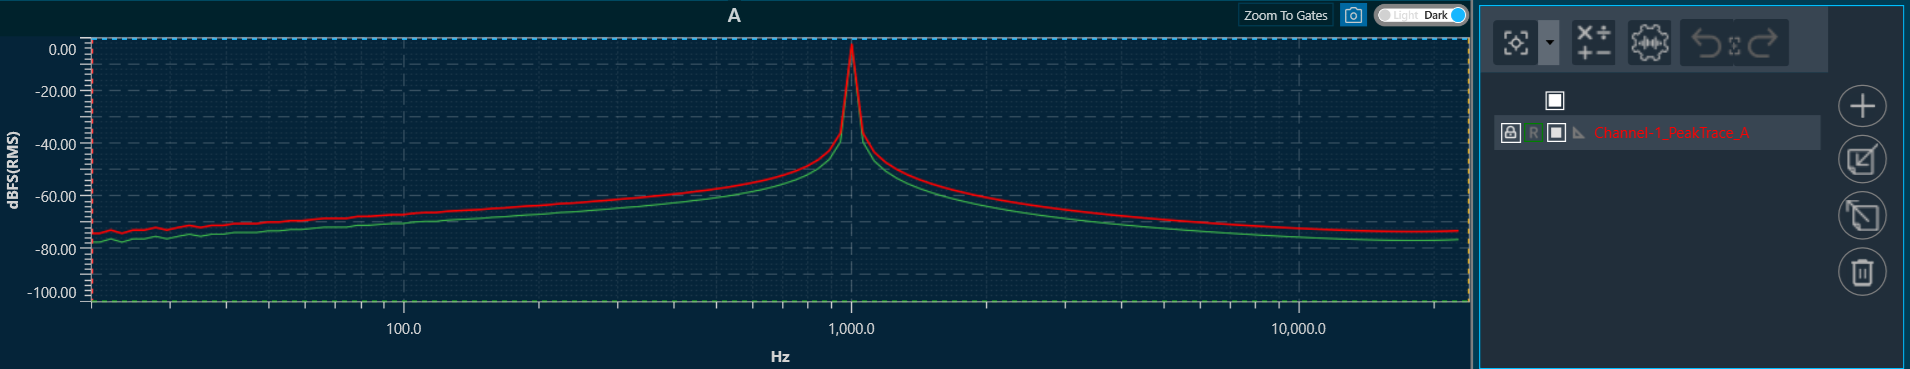
For example, for the 1 kHz sine wave, the live ribbon with peak trace enabled and graph will look as follows:
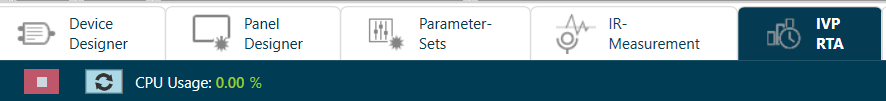
CPU Load
In the RTA graph view, the CPU load provided by Audio Engine is displayed in percentage (up to 2 decimals). This will be shown in different colors based on the level as below.
- Normal: 0-70 (Green color)
- Medium: 71-95 (Yellow color)
- High: Greater than 96 (Red color)