In the Channels setting window the numerical measurements are displayed for each channel.
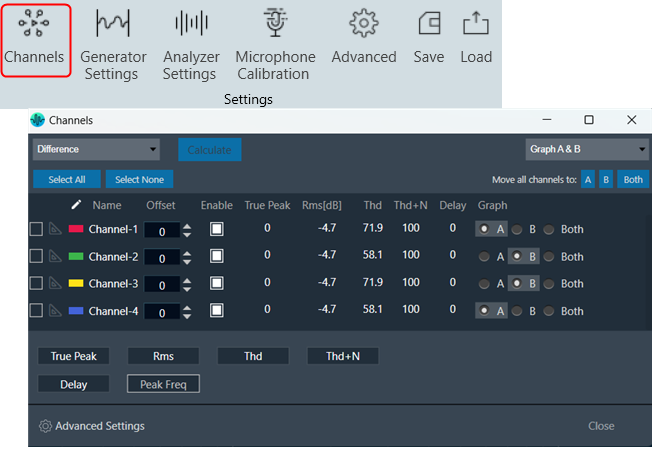
The channel viewer list contains the following columns:
- The first column indicates the color of the channel. This allows you to change the color of the channel by clicking on the color box.
- Name: Display the name of the channel. You can change the name in the Analyzer Settings dialog box.
- Offset: +/- Db shifting of measured and math operated channels.
- Enable: Channel enable and disable allow on display graphs on Analyzer window.
- Peak: The peak amplitude of the current block of analyzed audio samples.
- Rms: The sound level meter value, the unit as set in the Analyzer Settings (dBFS, dBV, dBSPL) with selected Weighting (A B C D).
- Thd: Total harmonic distortion in percentage (%).
- Thd+N: Total harmonic distortion plus noise in percentage (%).
- Delay: This value is calculated if Analyzer mode is set to ‘Delay’. The delay measurement is done by cross correlation between a reference channel and a channel that contains the reference signal that went through a certain path (example: amp – speaker – microphone). The delay can be calculated using the position of the maximum within the correlation result.
- Peak Freq: The frequency of the maximum level in the measured spectrum in Hz.
- Graph: Radio buttons allow you to quickly select the graph that displays that channel
By using the Peak, Rms, Thd, Thd+N, Delay, and Peak-Frequency buttons, you can select which values to display in the list.
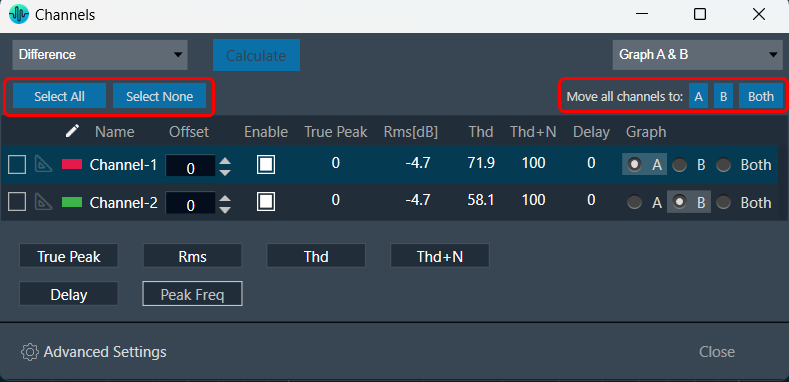
In addition to assigning individual channels to specific graphs, you can also perform bulk assignments. If no channels are selected, you can use the “Move all channels to A, B, or Both” button to move all channels, including calculated channels, to the desired graph.
If one or more channels are selected, the same buttons will only move the selected channels to the desired graph.
You can use the “Select All” and “Select None” buttons to check or uncheck all channels, respectively.
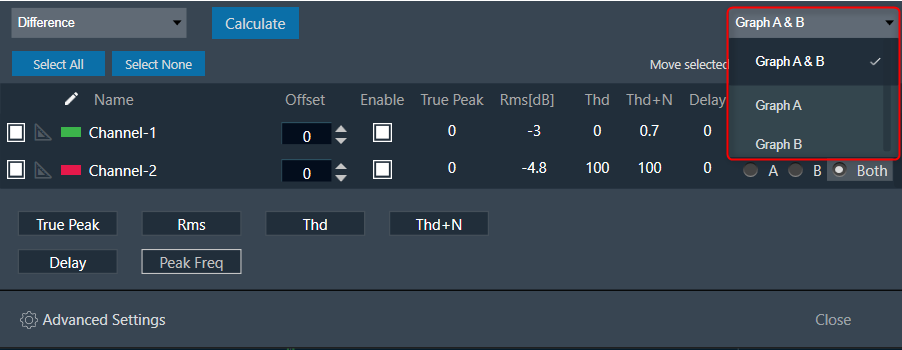
The selector control located at the top left of the window enables you to choose which group of channels to display in the list: all channels (Graph A & B), only Graph A channels or only Graph B channels.
The channel window is designed to remain on top of other windows and can be resized as needed, making it easy to keep open for value observation while using the RTA.
Click on the “Advanced Settings” to perform additional configuration. For more details about Advanced configuration, refer to the RTA Advanced Settings.
Math operation on Live Channels
To perform math operations:
- Select any two channels.
- Click on the Calculate button to get the math operation result.
Math operated channel is listed on the same view.
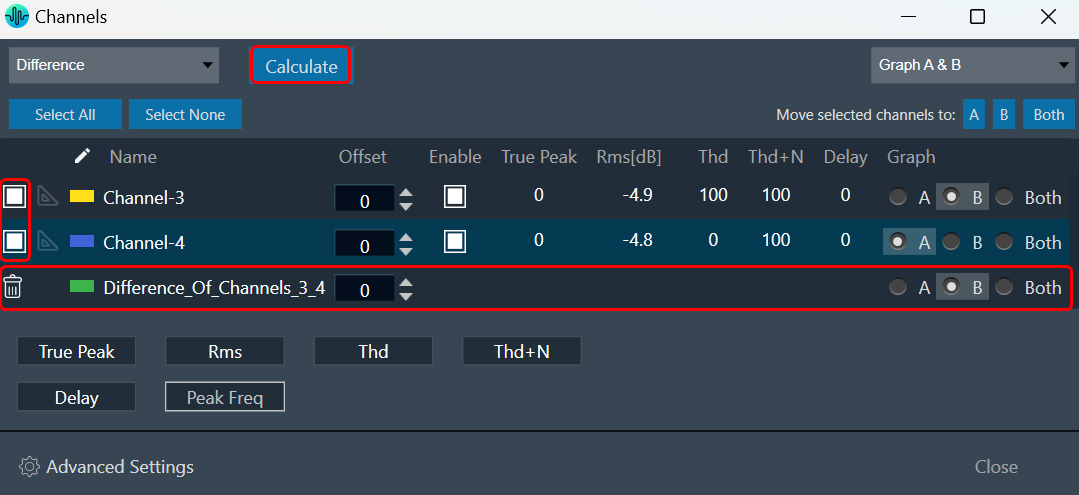
You can delete Math operated channel and as a tooltip, you can find which channels are selected for math operations.
Only one Math operated channel can be created for combinations of measured channels.