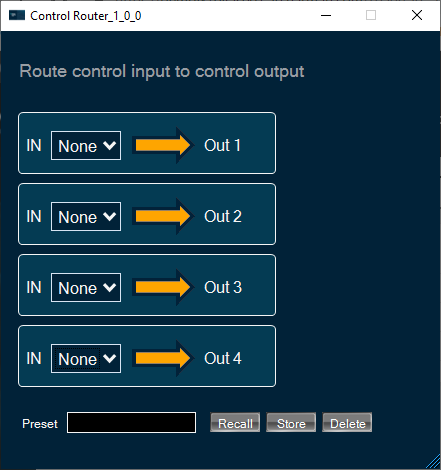
The XoverBiquad panel is to tune XoverBiquad audio object. The audio object computes crossover bi-quadratic filter coefficients in the Xover Biquad panel, which also computes the output of the input audio buffers processed through the filters that users specify for each channel.
The frequency axis scale based on the minimum value of either the maximum value of Frequency StateVariable or (Selected Sample Rate / 2 )* 0.999.
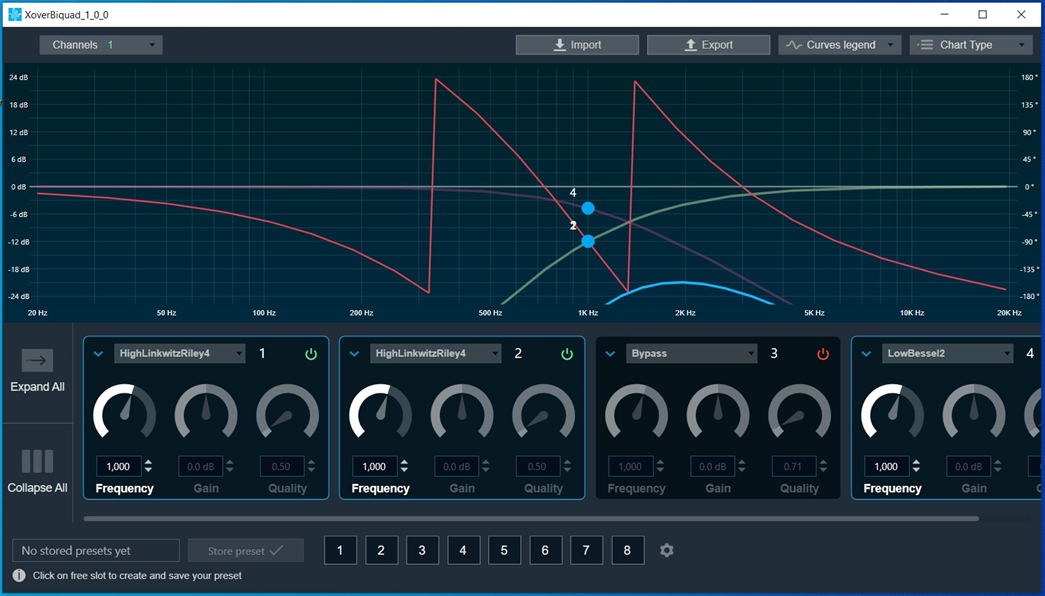
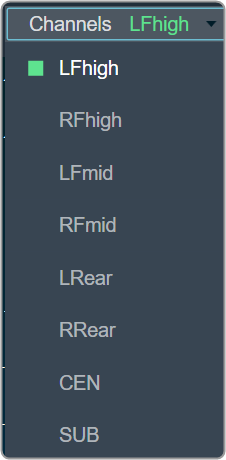
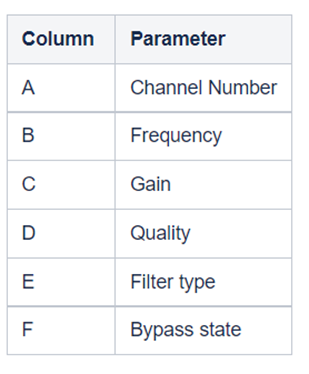
Channel List
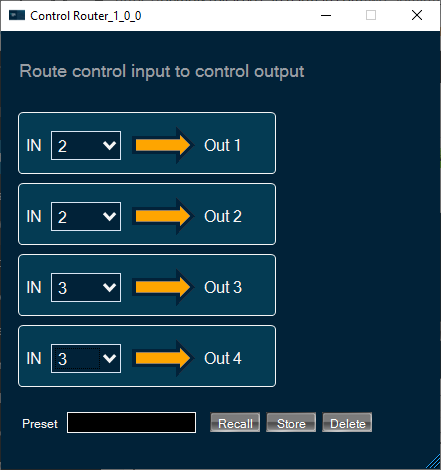
On the Xover Biquad panel, you have the option to choose a channel for the current core from a list located at the top left.
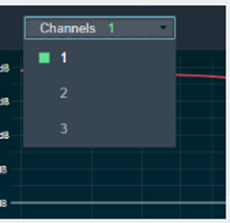
The current channel is marked with a green square and its number is displayed in the header of the channel list.
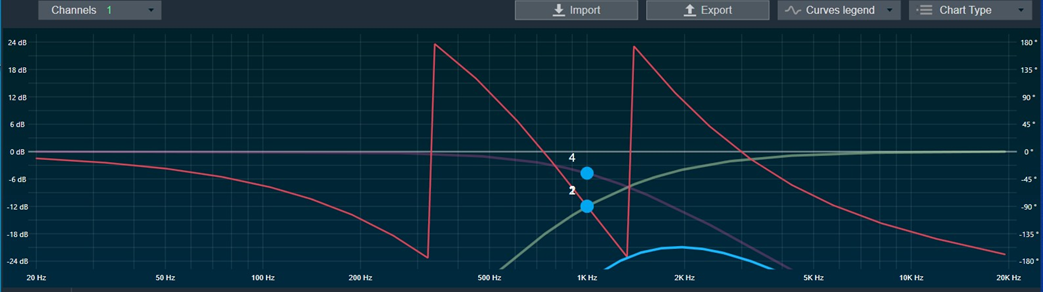
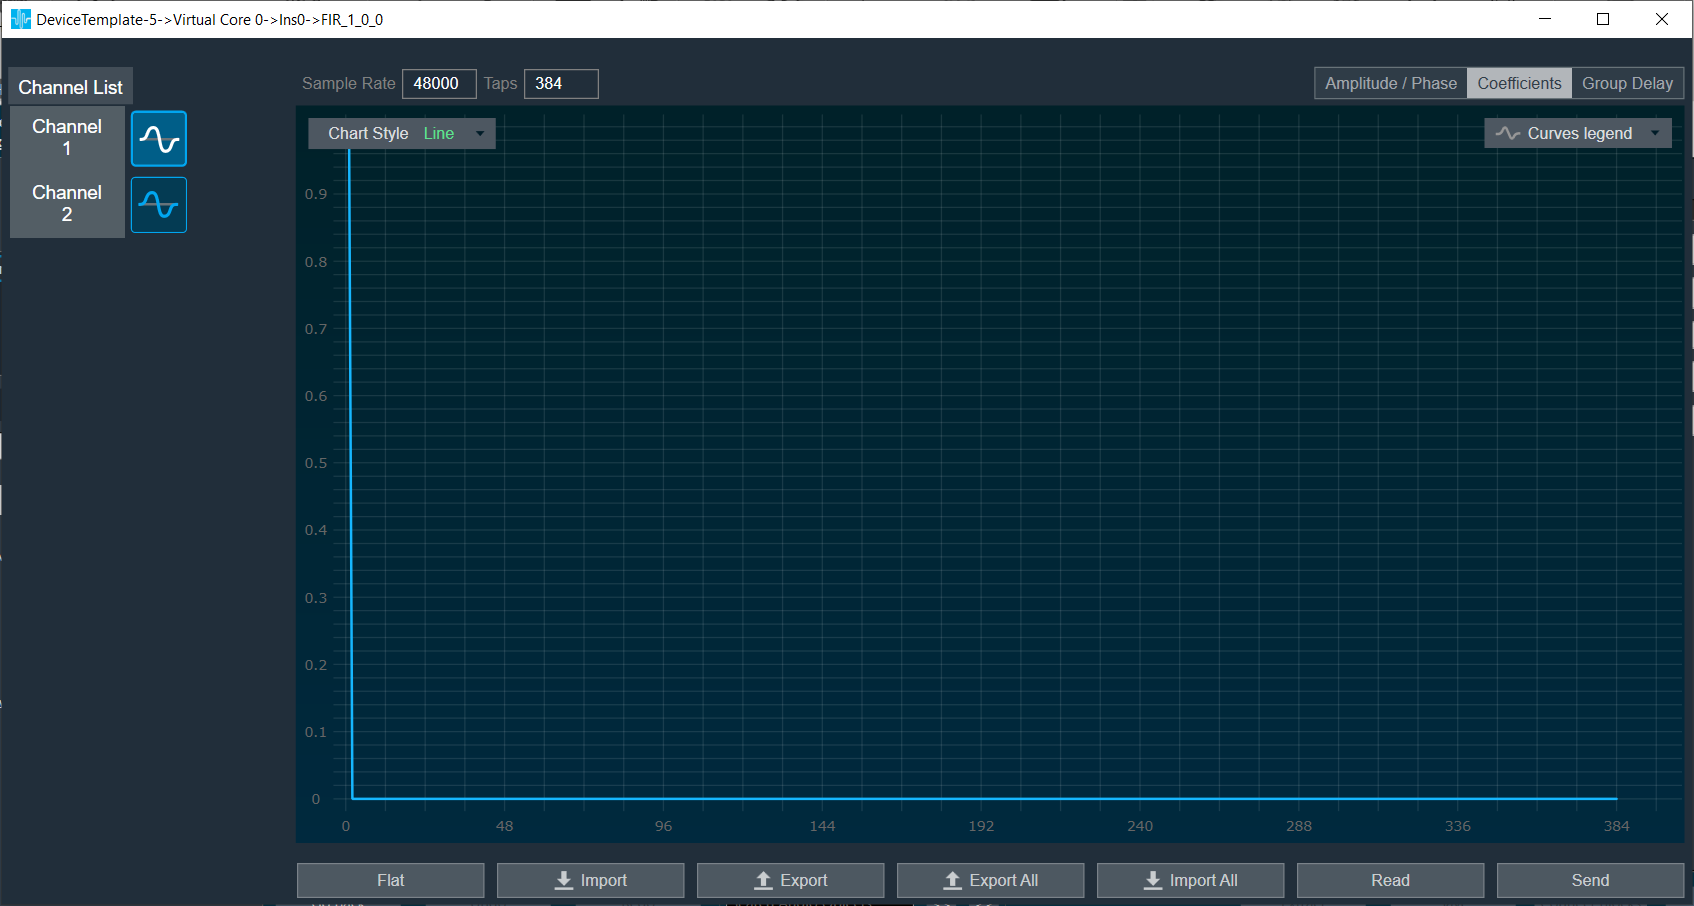
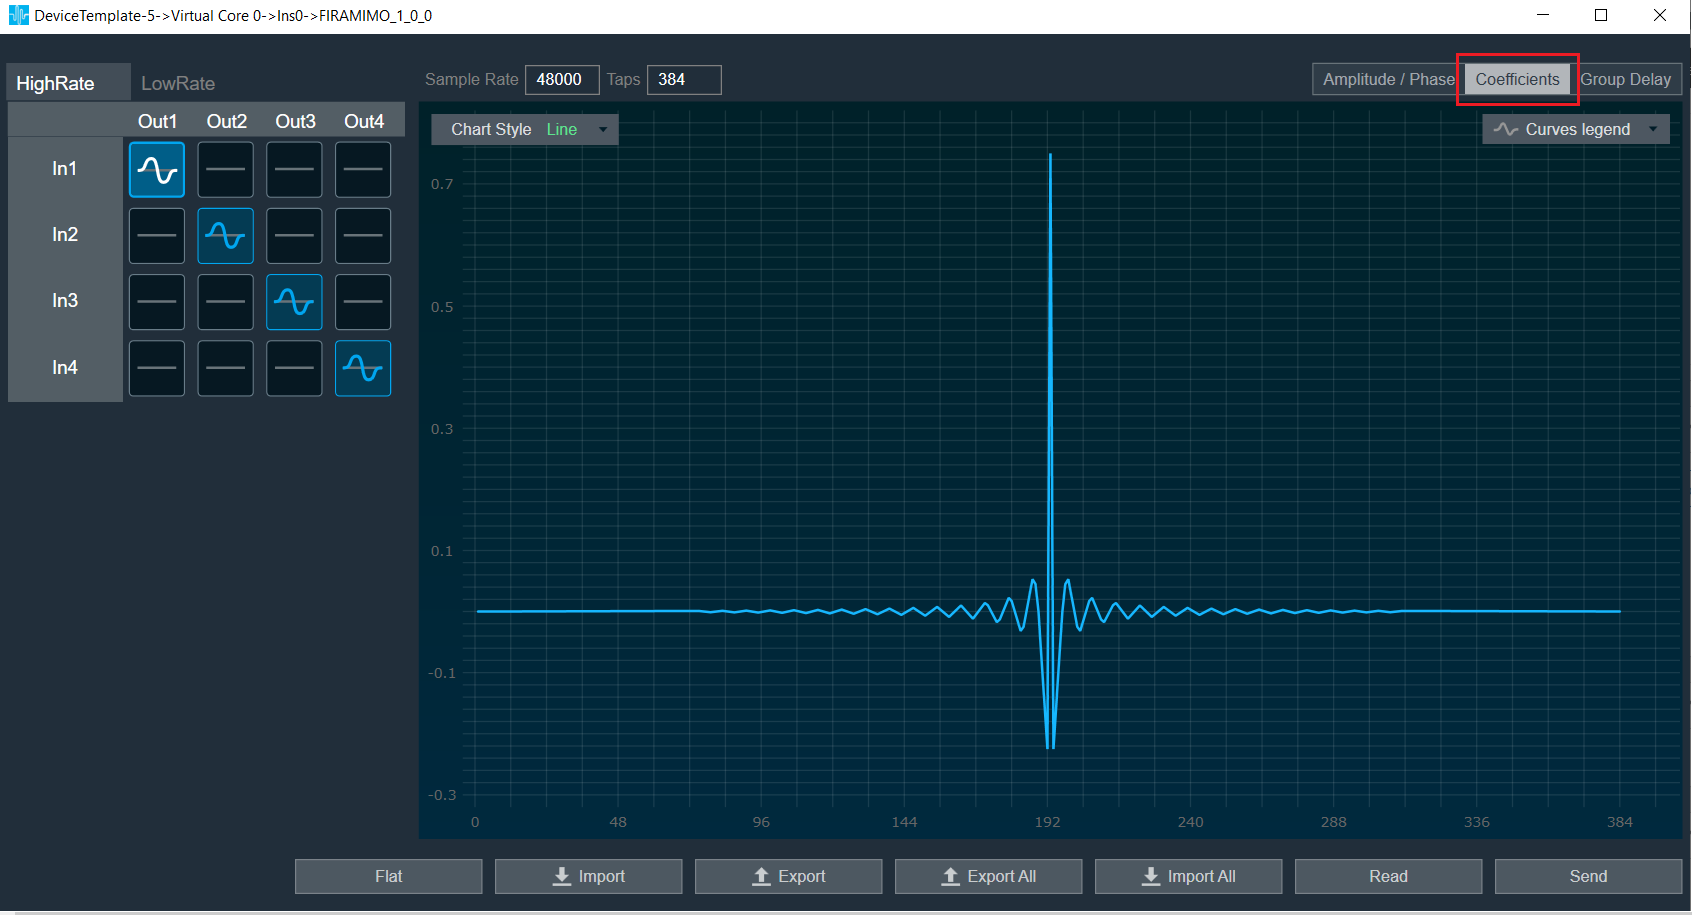
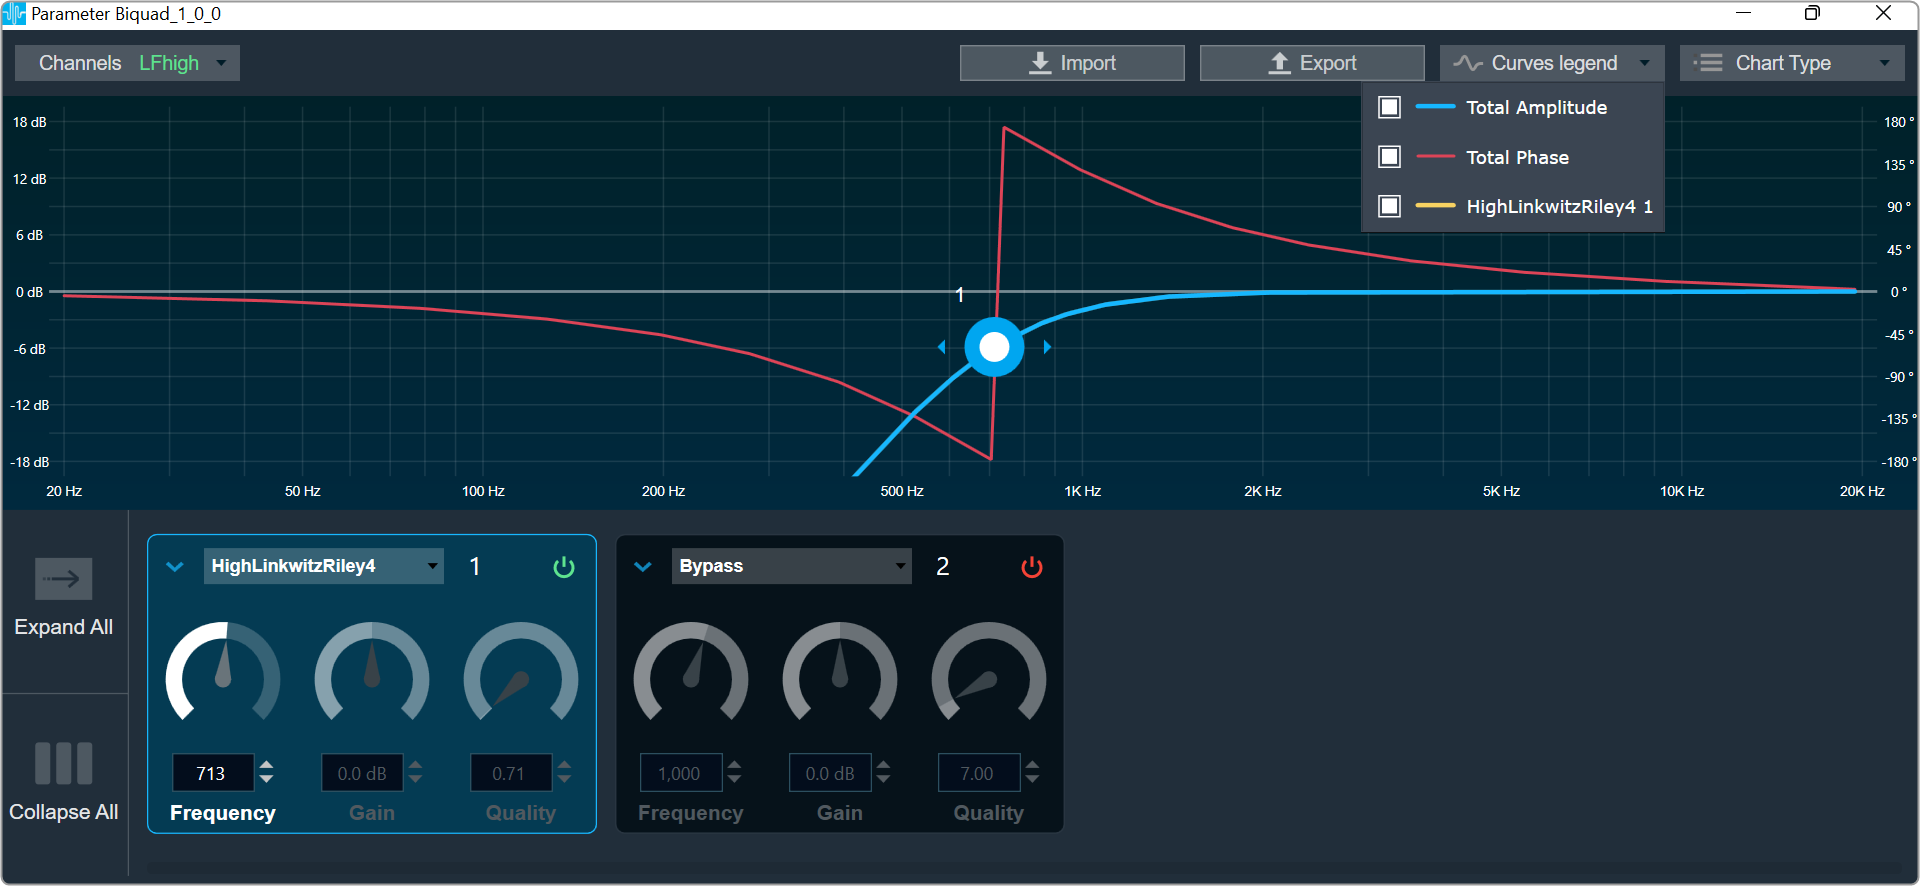
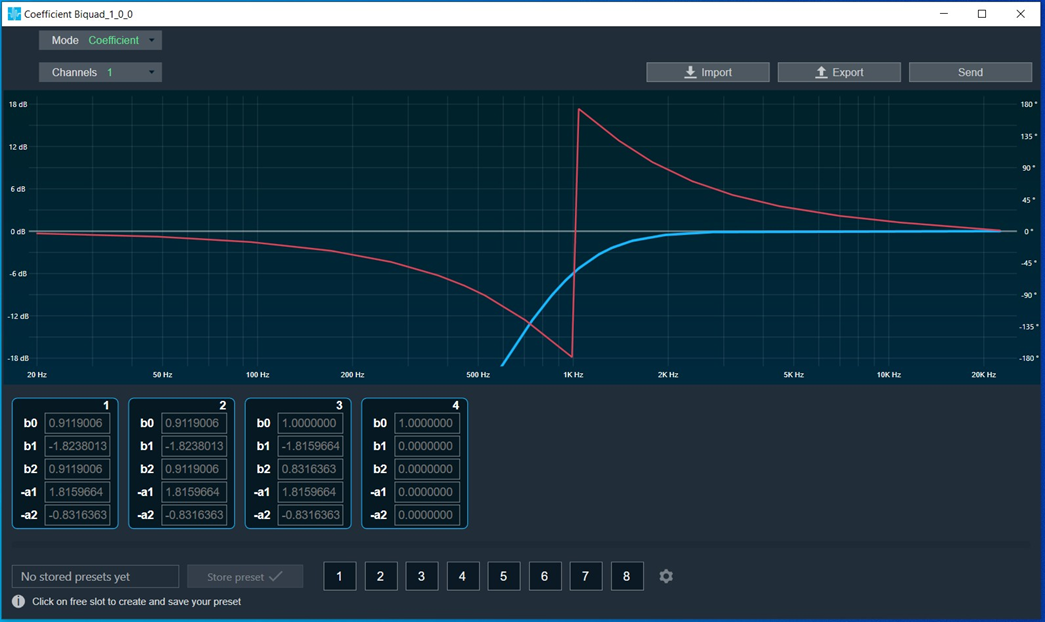
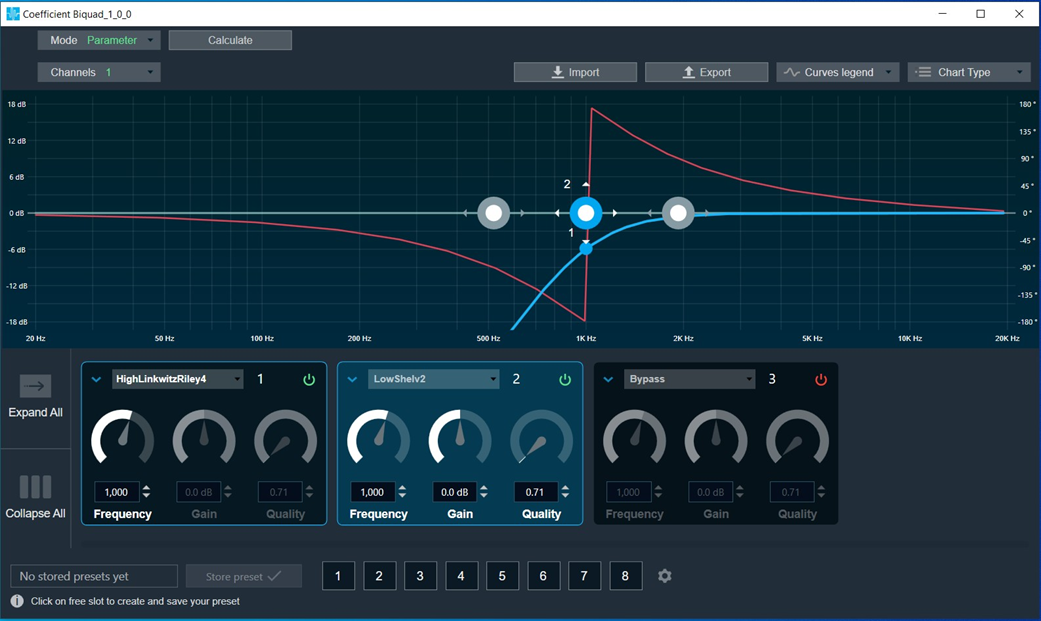
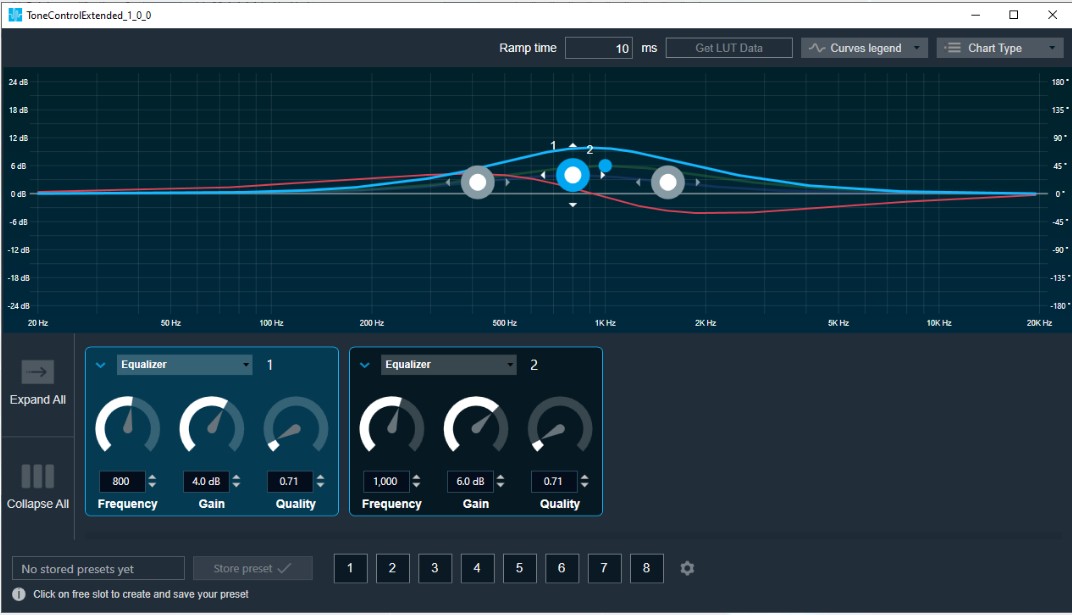
Xover Biquad Chart
This chart represents the influence of all Biquads on the frequency and phase response. The left axis shows the amplitude in dB, and the right axis shows the phase in degrees and the X- axis shows the gain.
The number of Biquads are defined with the Signal Flow Designer. The Biquads get dynamically managed inside the GTT. Most of the Biquads are represented by appropriate markers.
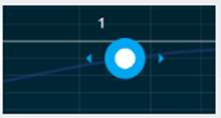
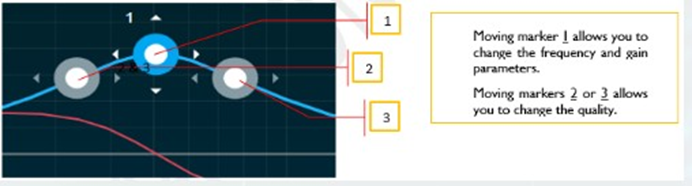
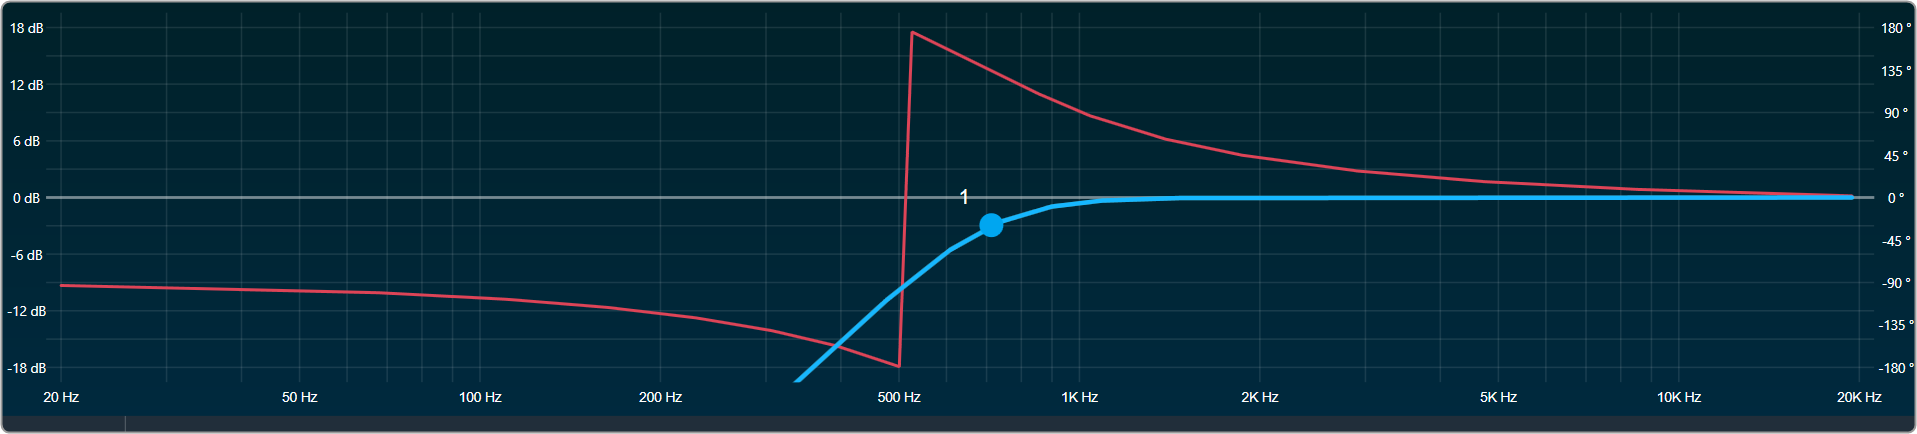
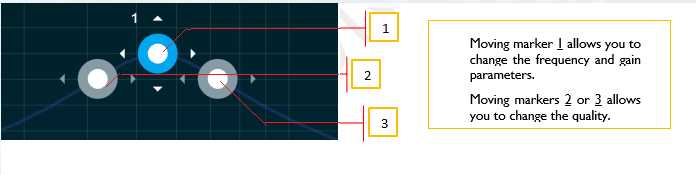
Markers
Markers are movable. Moving them allows you to modify frequency parameter.
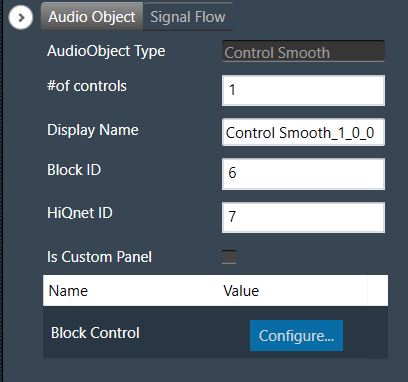
Biquad Settings

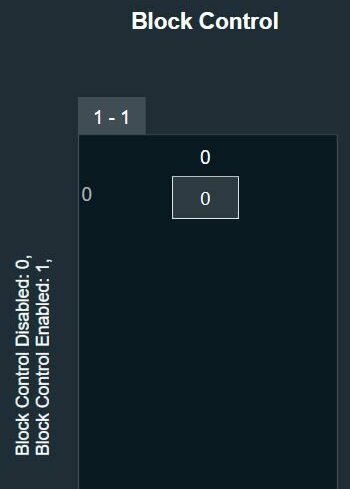
Enabling Bypass
- Click on the
 Bypass button to enable or disable Bypass.
- In bypassed state, the button is red colored and green colored when biquad is in non-bypassed state.
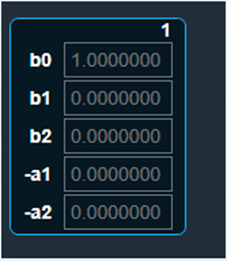
Biquad is in a bypassed state by default.
Even the higher order filter in Xover biquad only uses one biquad, so the number of bands assigned to the object will be equal to the number of biquads in the panel. Therefore, when the panel launches, it contains all of the biquads.
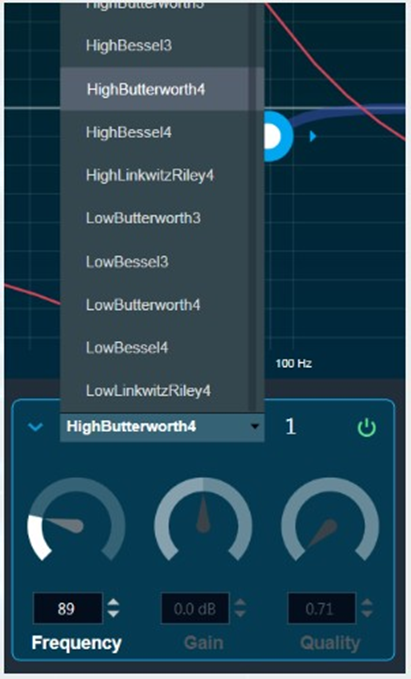
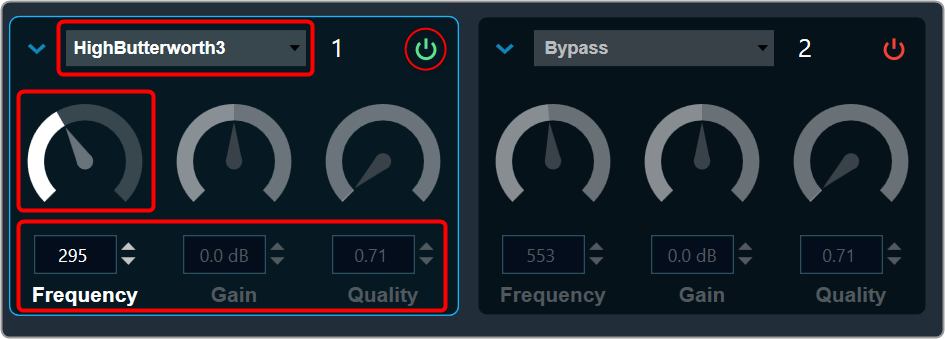
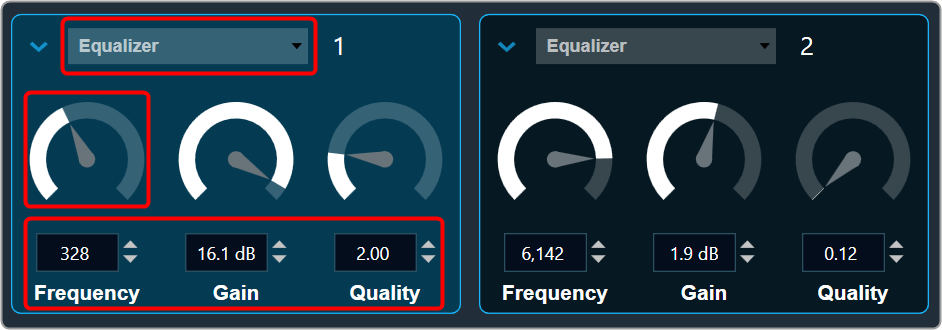
Change the Frequency, Gain, and Quality
Frequency: It is used to set the center frequency of each filter.
Gain: Gain is set to zero dB for all the filter types.
Quality: It is used to set the width of each band pass or notch type band of the filter. It is set to 0.58 for Bessel type filters, 0.50 for the LinkwitzRelay type filters and 0.71 for other types of filters.
- Using the increment and decrement buttons
 you can change the value.
Or
- Select the tuner and use mouse scroll to adjust the value
Change Biquad Type
The Biquad Filter Menu shows a list of all Biquads that are set up in the amplifier for the current channel. You can change the Biquad type in the combo box.
You cannot add new filters to the Xover Panel. All available filters are added and bypassed at panel startup.
Xover Biquad supports Higher order filters, hence there is no necessity to merge nor split of biquads.
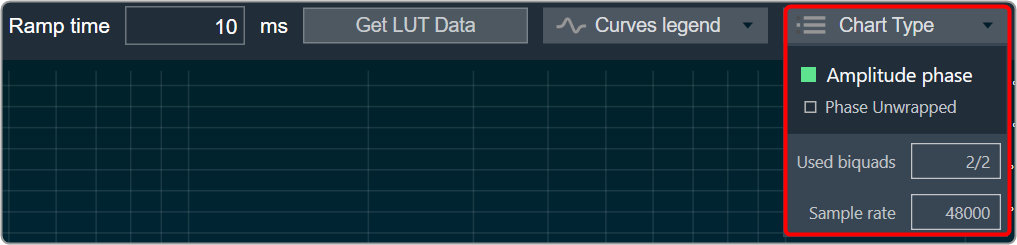
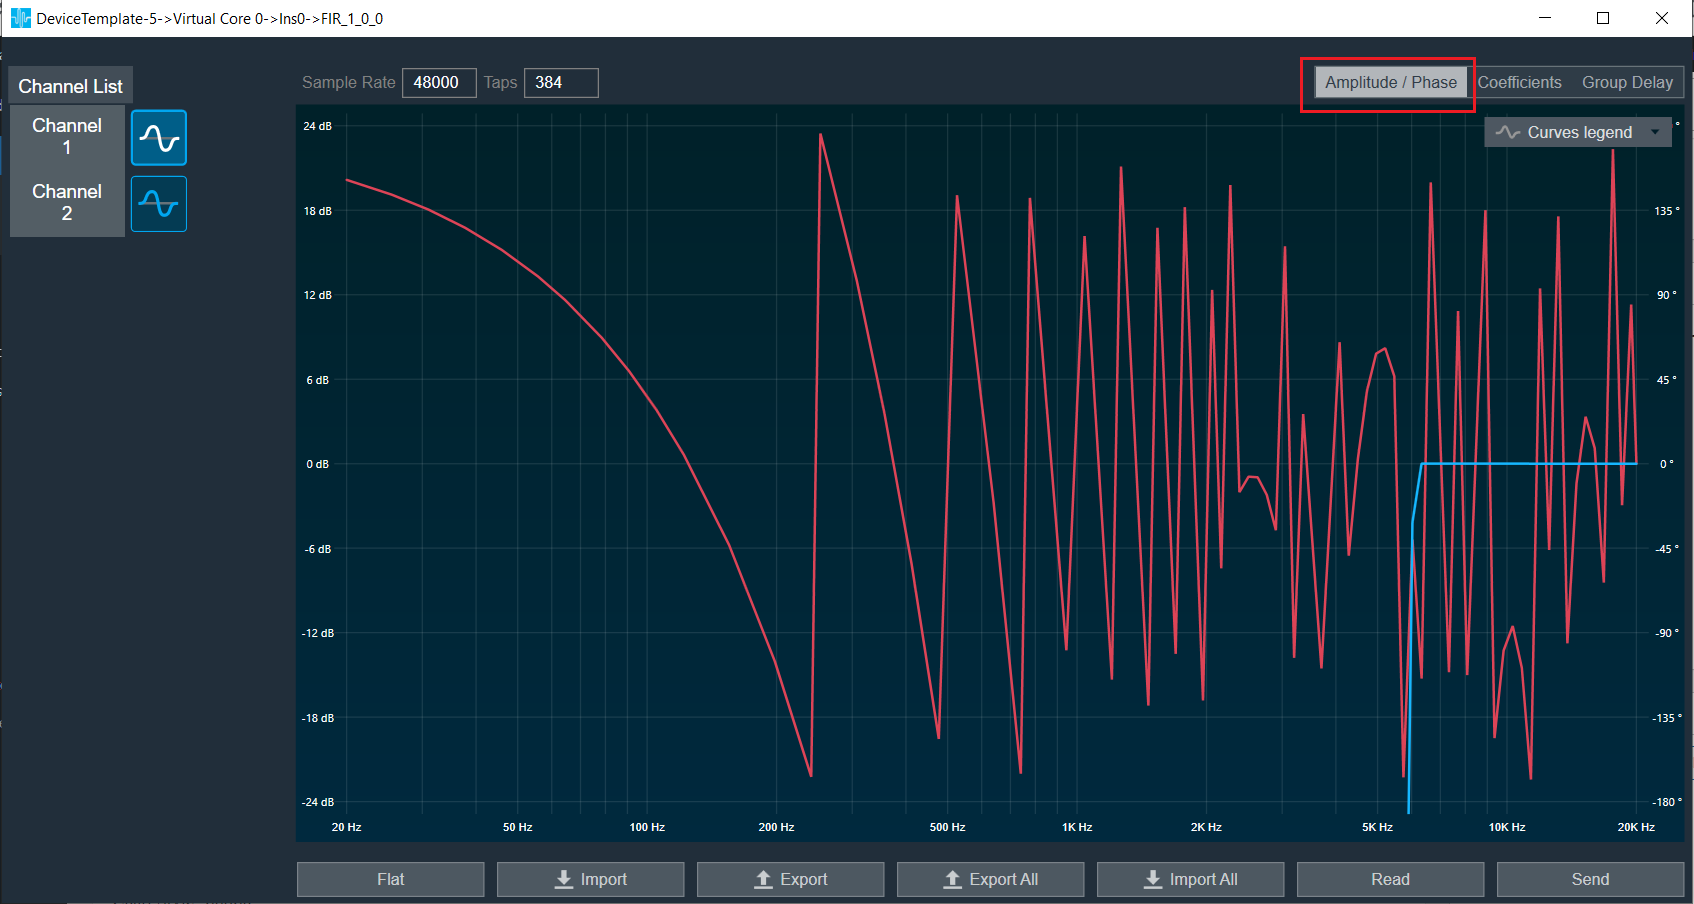
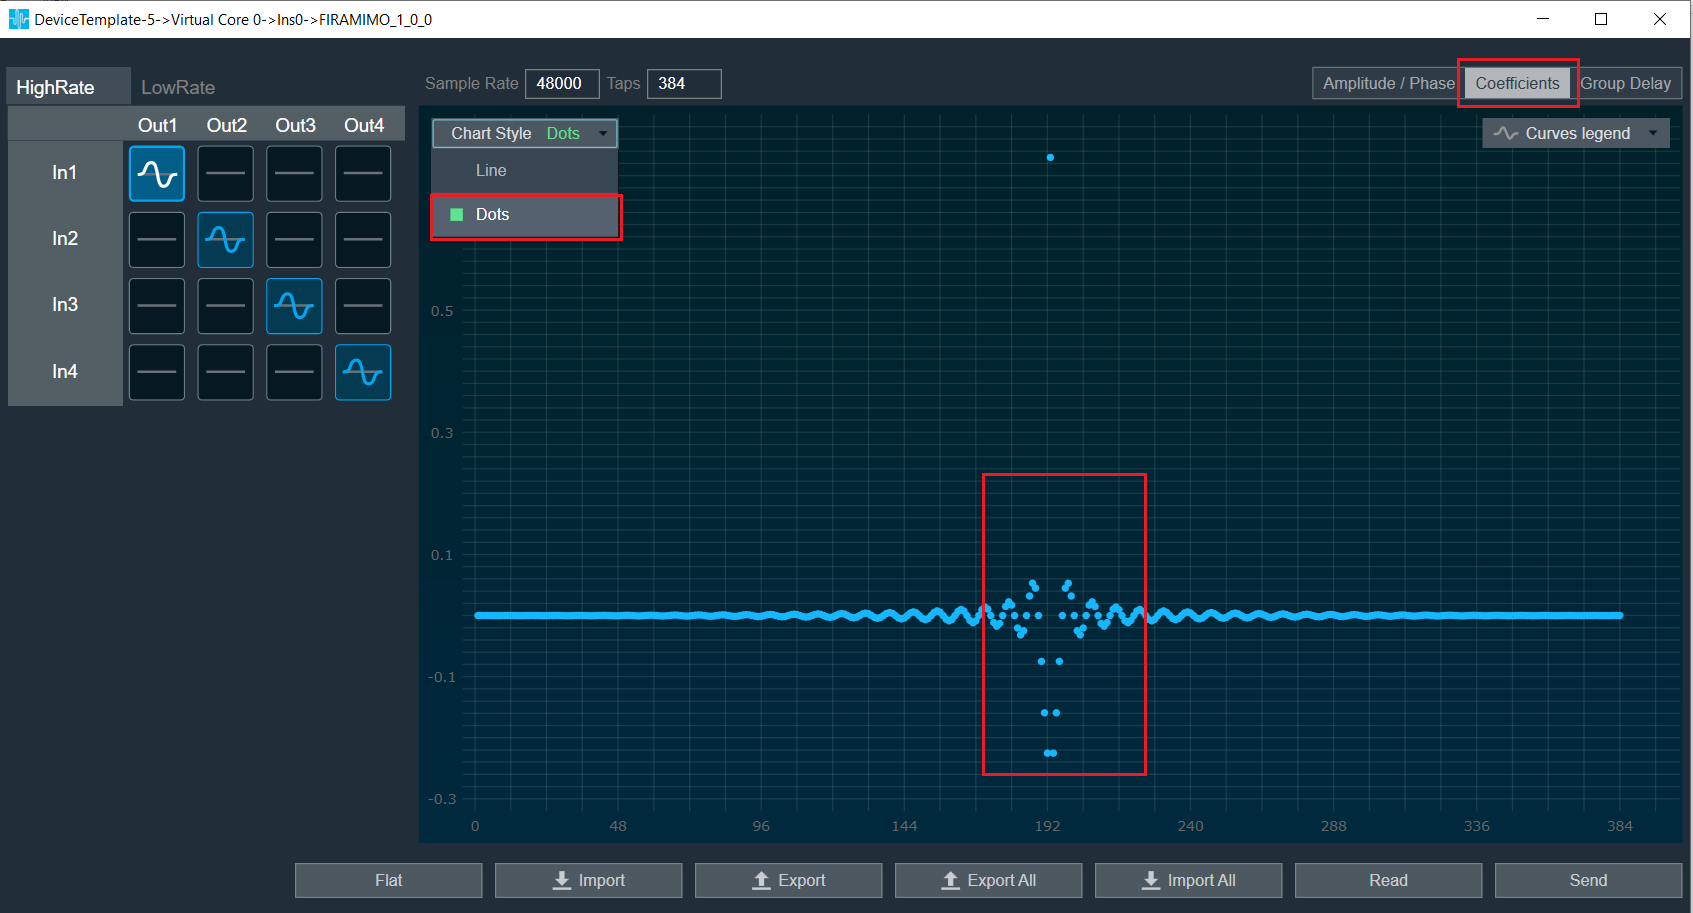
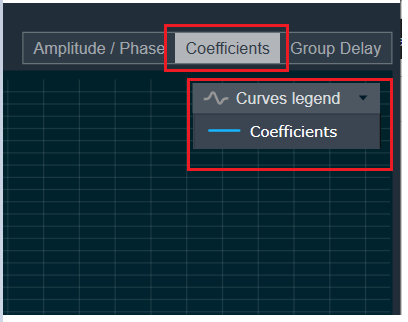
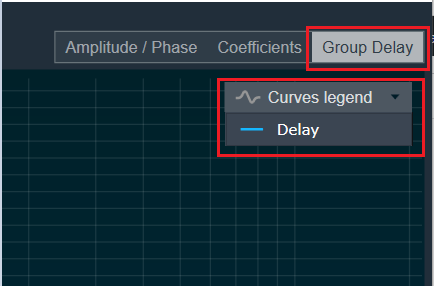
Biquad Chart Type
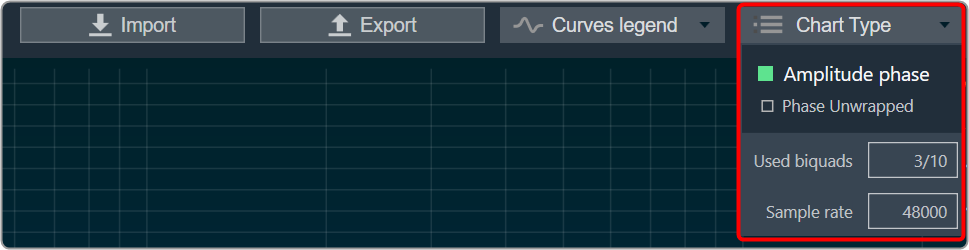
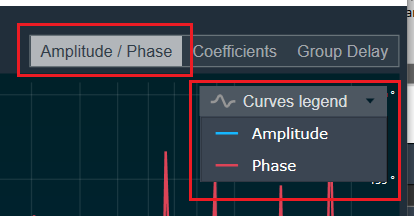
Amplitude phase: It is used to turn on and off appropriate charts.
Phase Unwrapped: It displays absolute values.
- If the phase is wrapped, the display is limited to ± 180 °.
- If the phase exceeds 180 ° or -180 ° it is continued on the other side of the vertical scale.
Used Biquads: This informs you about the available Biquads. The first number is the number of Biquads that have not been bypassed. The second number is the number of available Biquads.
Sample Rate: It shows the sample rate at which the filters are operated.
This panel is supported from audio library version 13.0.0.2016 (M-release) onwards. After loading the library import the project again to launch the Xover panel.
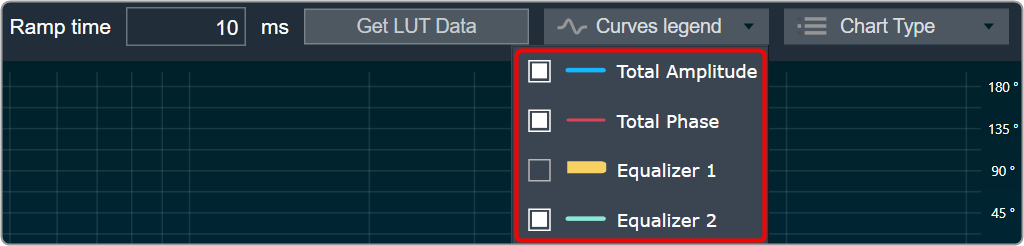
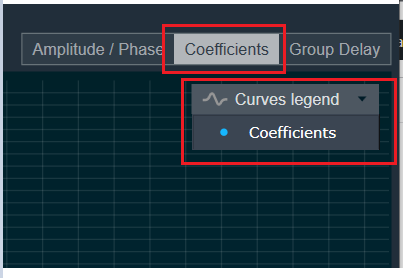
Biquad Curve Legend
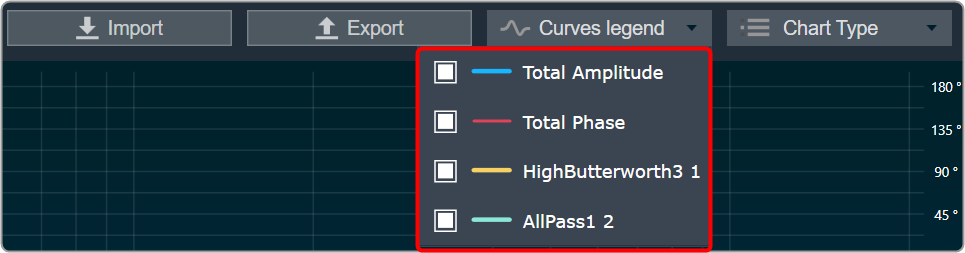
Click on Curve Legend to display all the associated legends. By default, all the curve legends are enabled on the graph. Uncheck the curve to hide it from the graph.
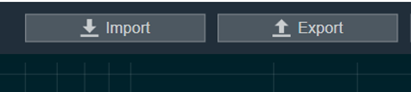
Export & Import
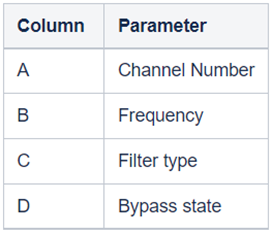
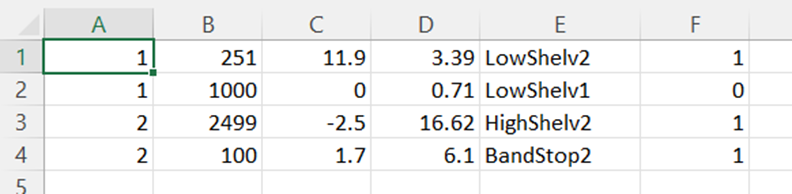
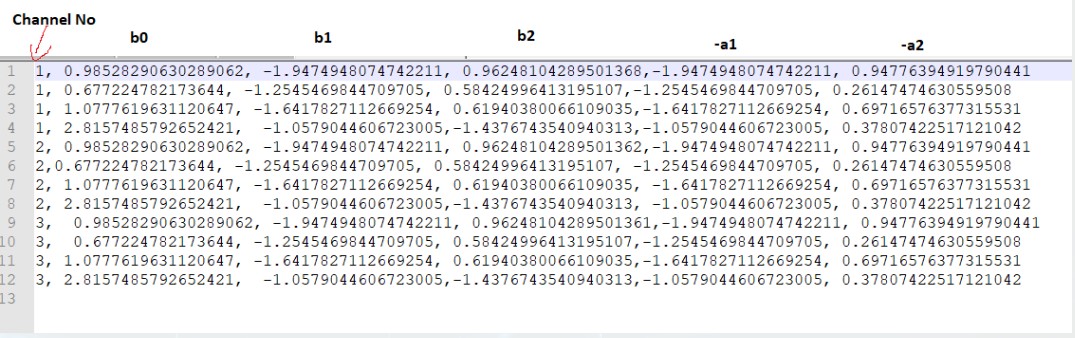
Biquad parameters can be exported by clicking the export button as csv in the below format.

The biquad parameters can be exported in the following format by clicking the export button as a CSV file.
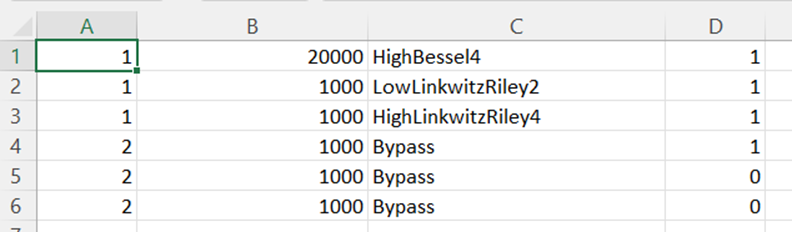
The exported file can be imported back to the panel using the import button.


 Bypass button to enable or disable Bypass.
 you can change the value.
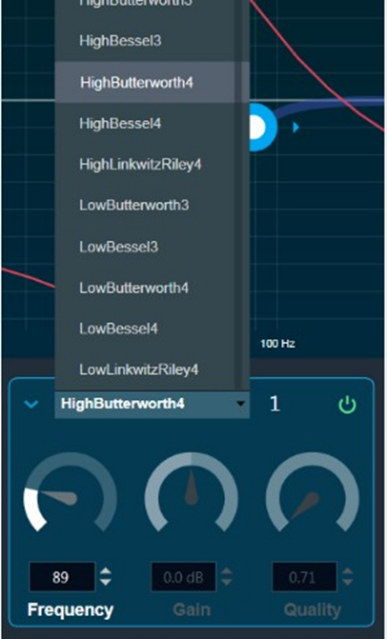


 you can change the value.