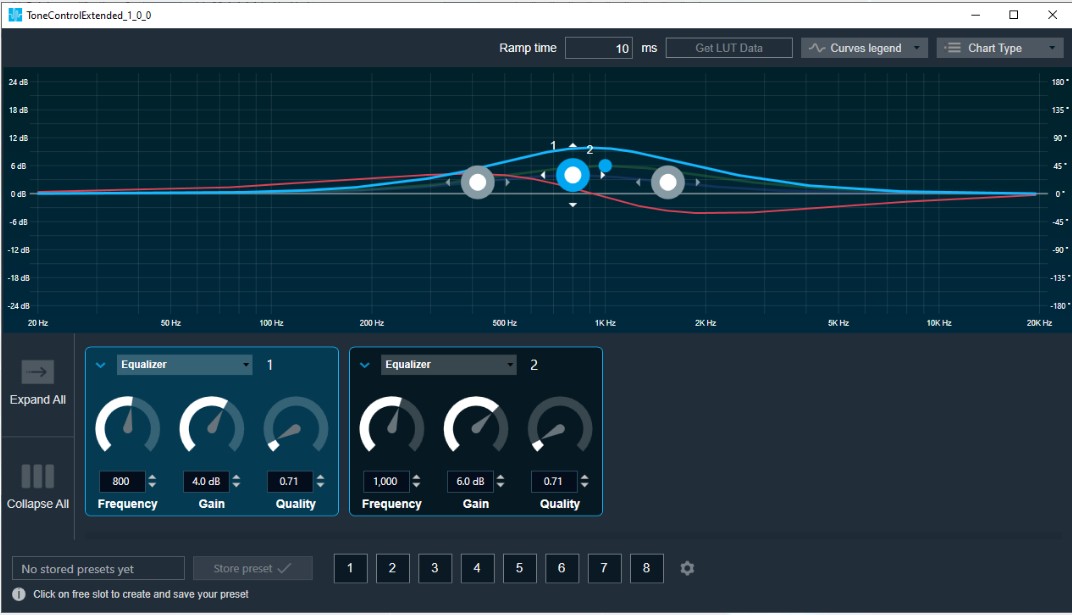
FIR Filter native panel allows you to configure the Mode of each enabled filter and to load coefficients as well. In order to see the graphs, you need to import coefficients. Use ‘Import’ or ‘Import All’ option to import coefficients.
To open the native panel, double-click on the FIR Filter audio object in the signal flow designer.
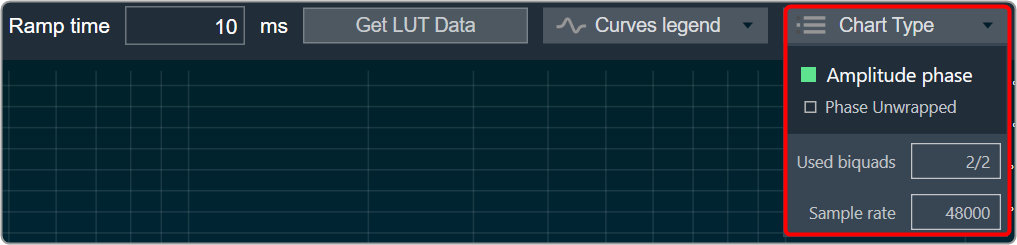
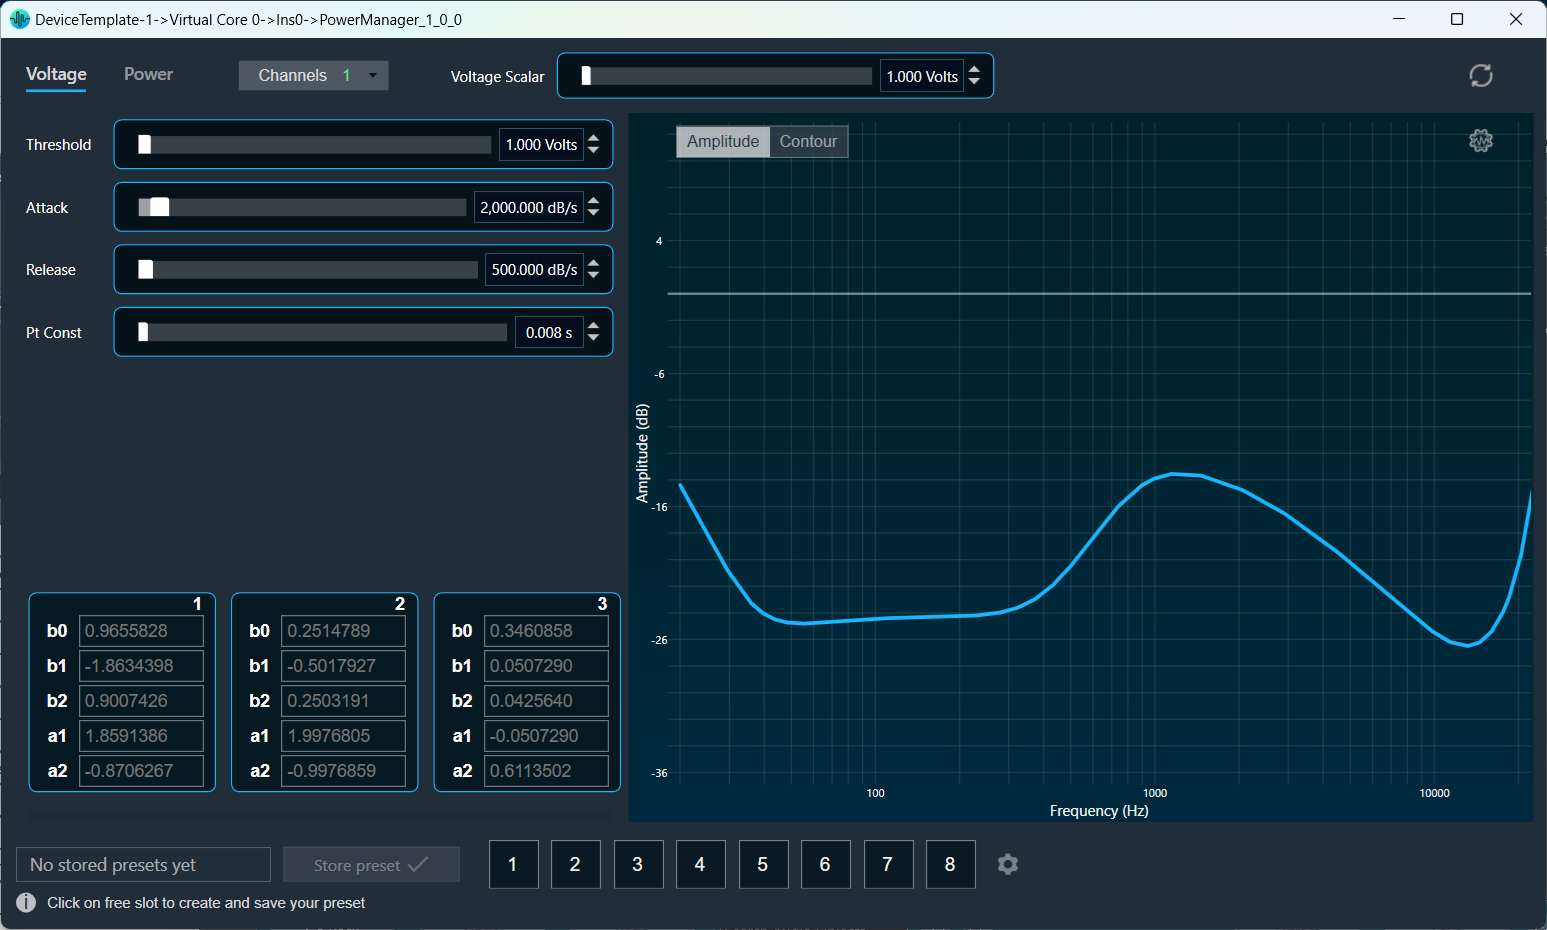
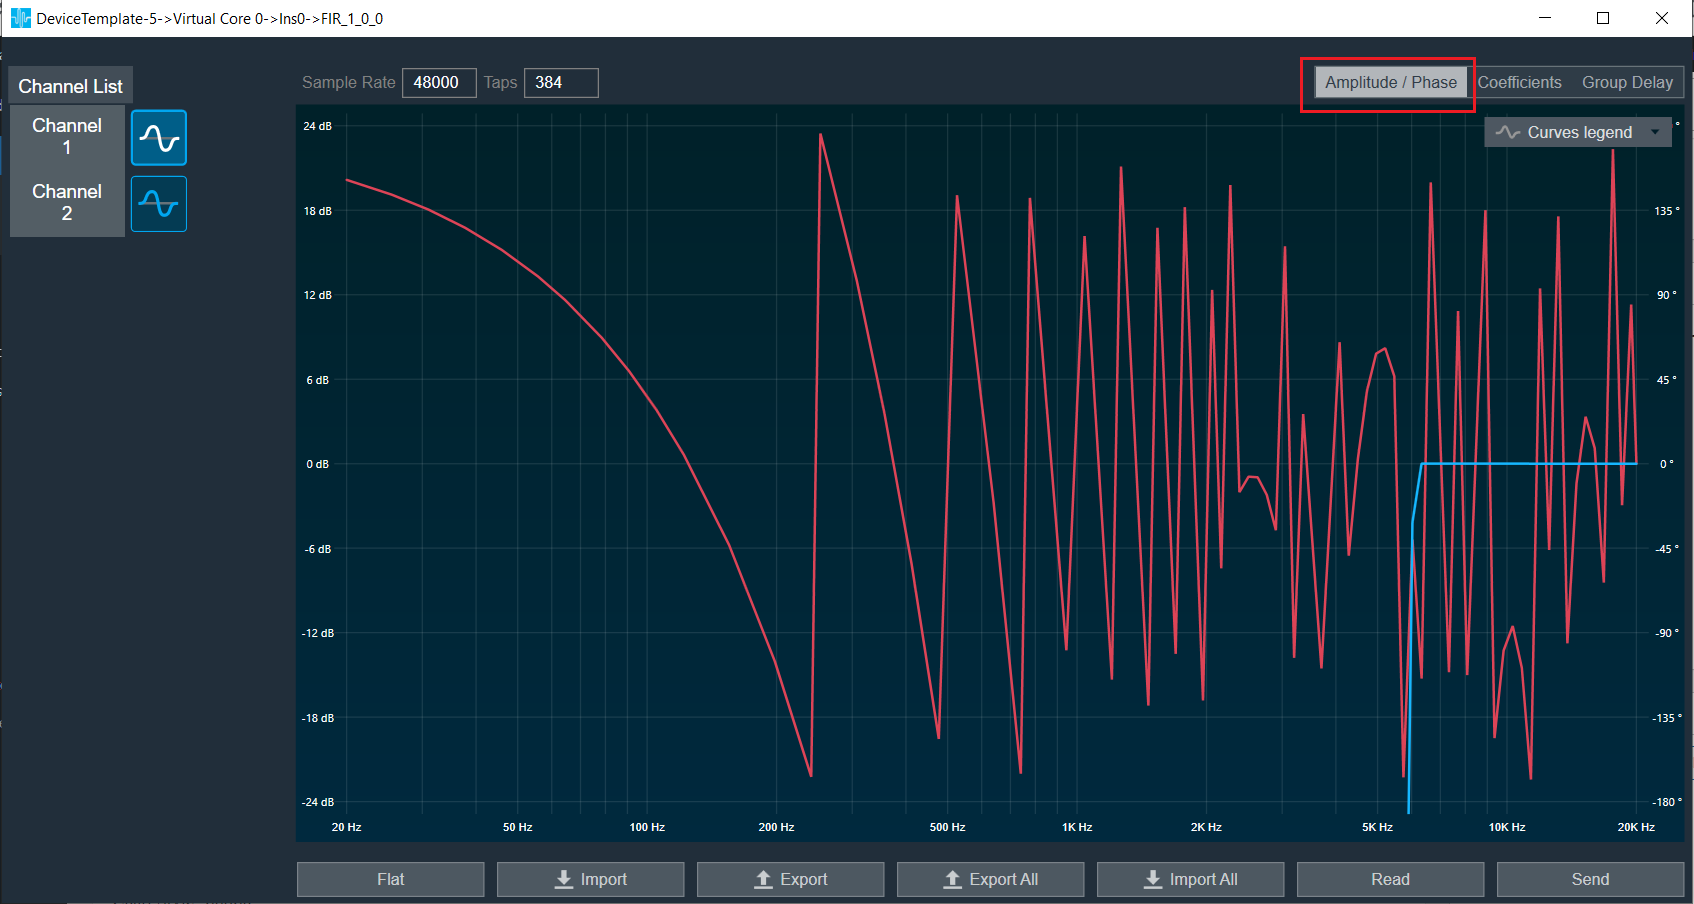
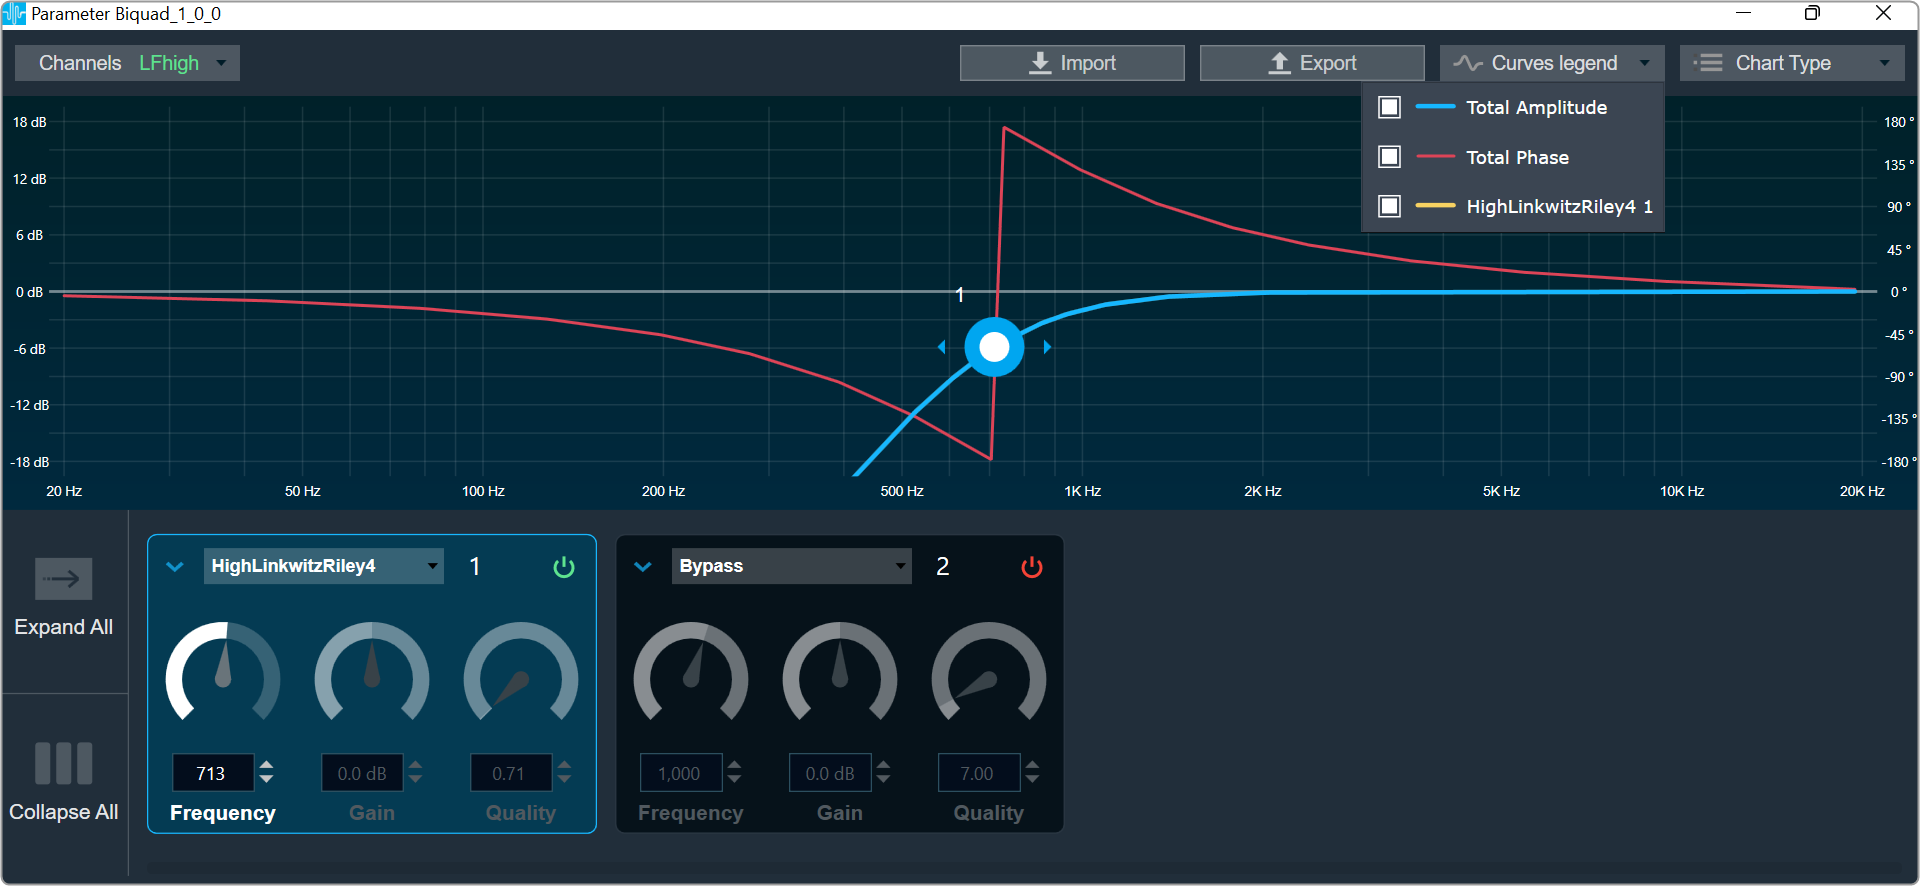
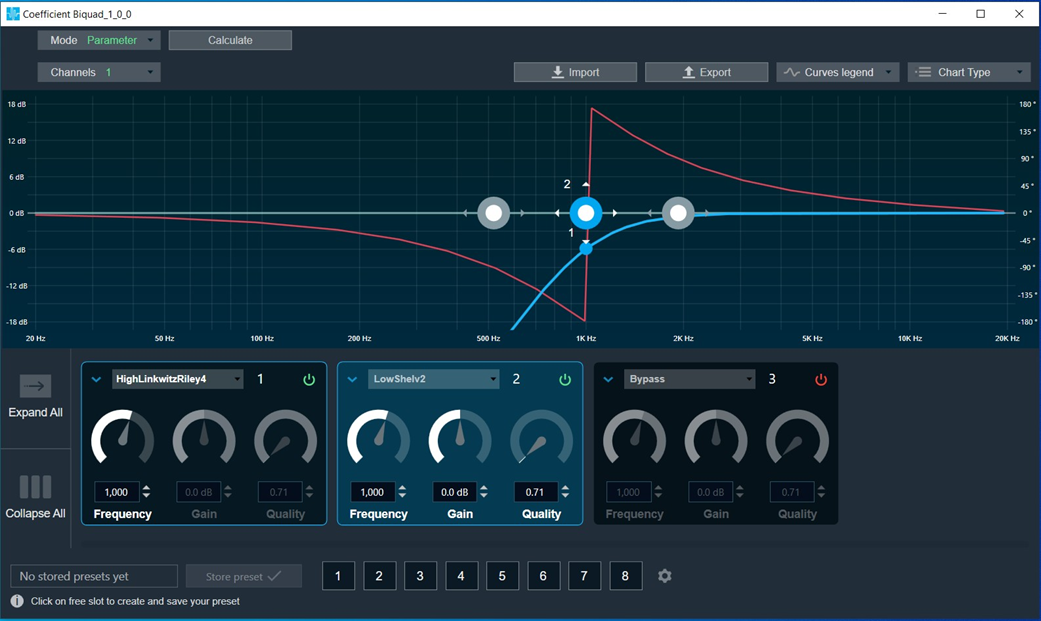
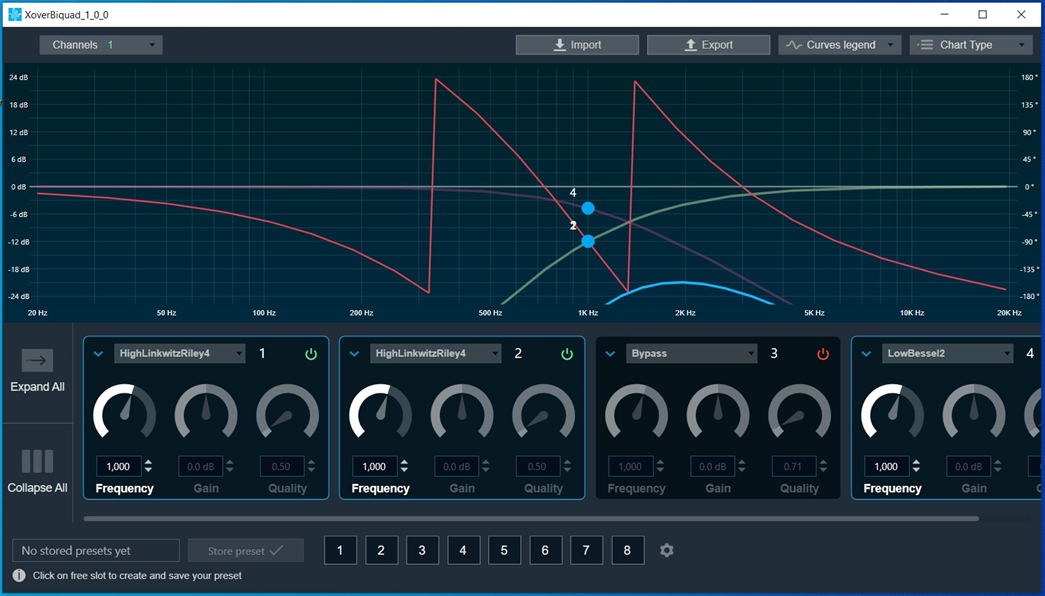
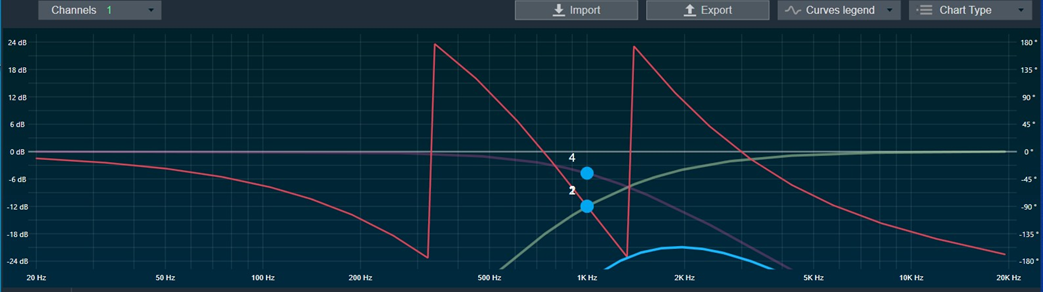
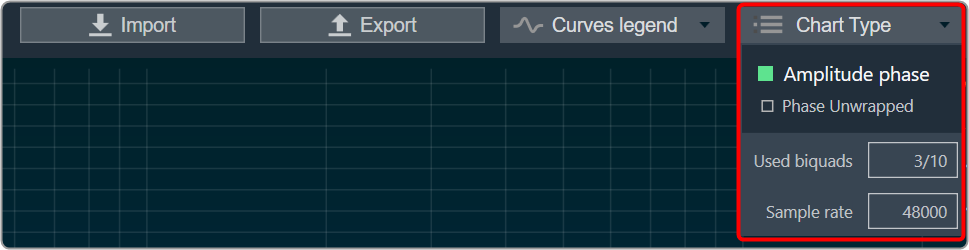
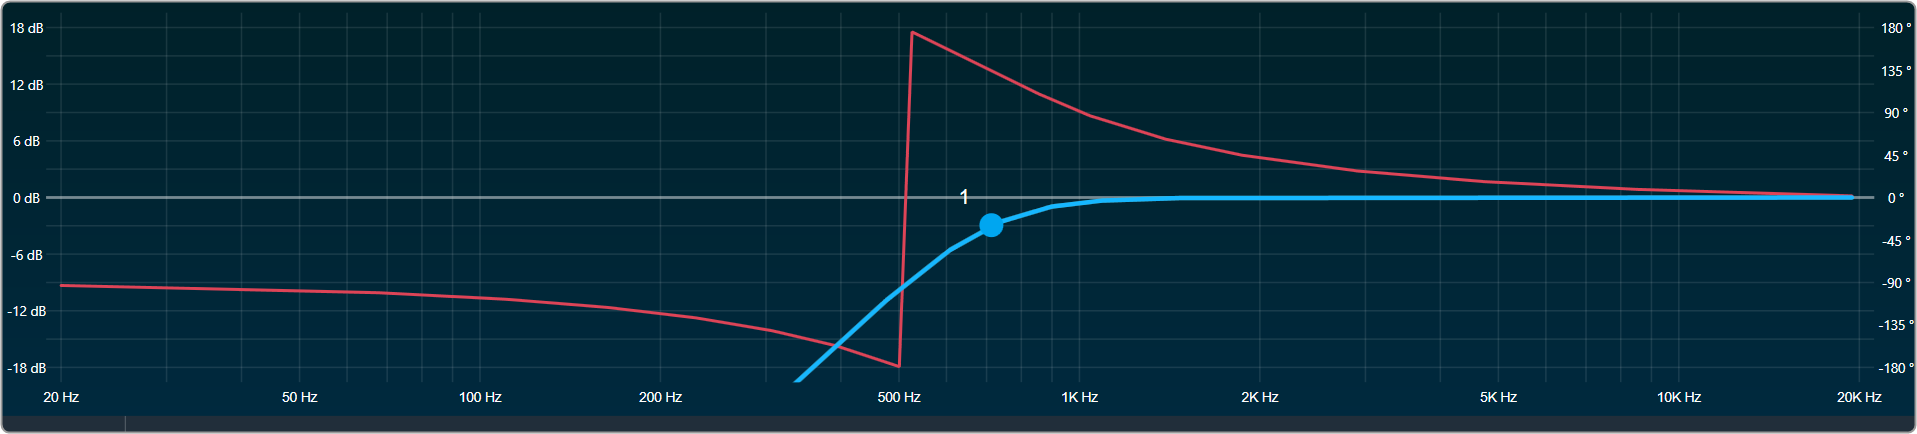
Amplitude/Phase: When the coefficients are given and “Amplitude/Phase” option is selected, the graph display the value.
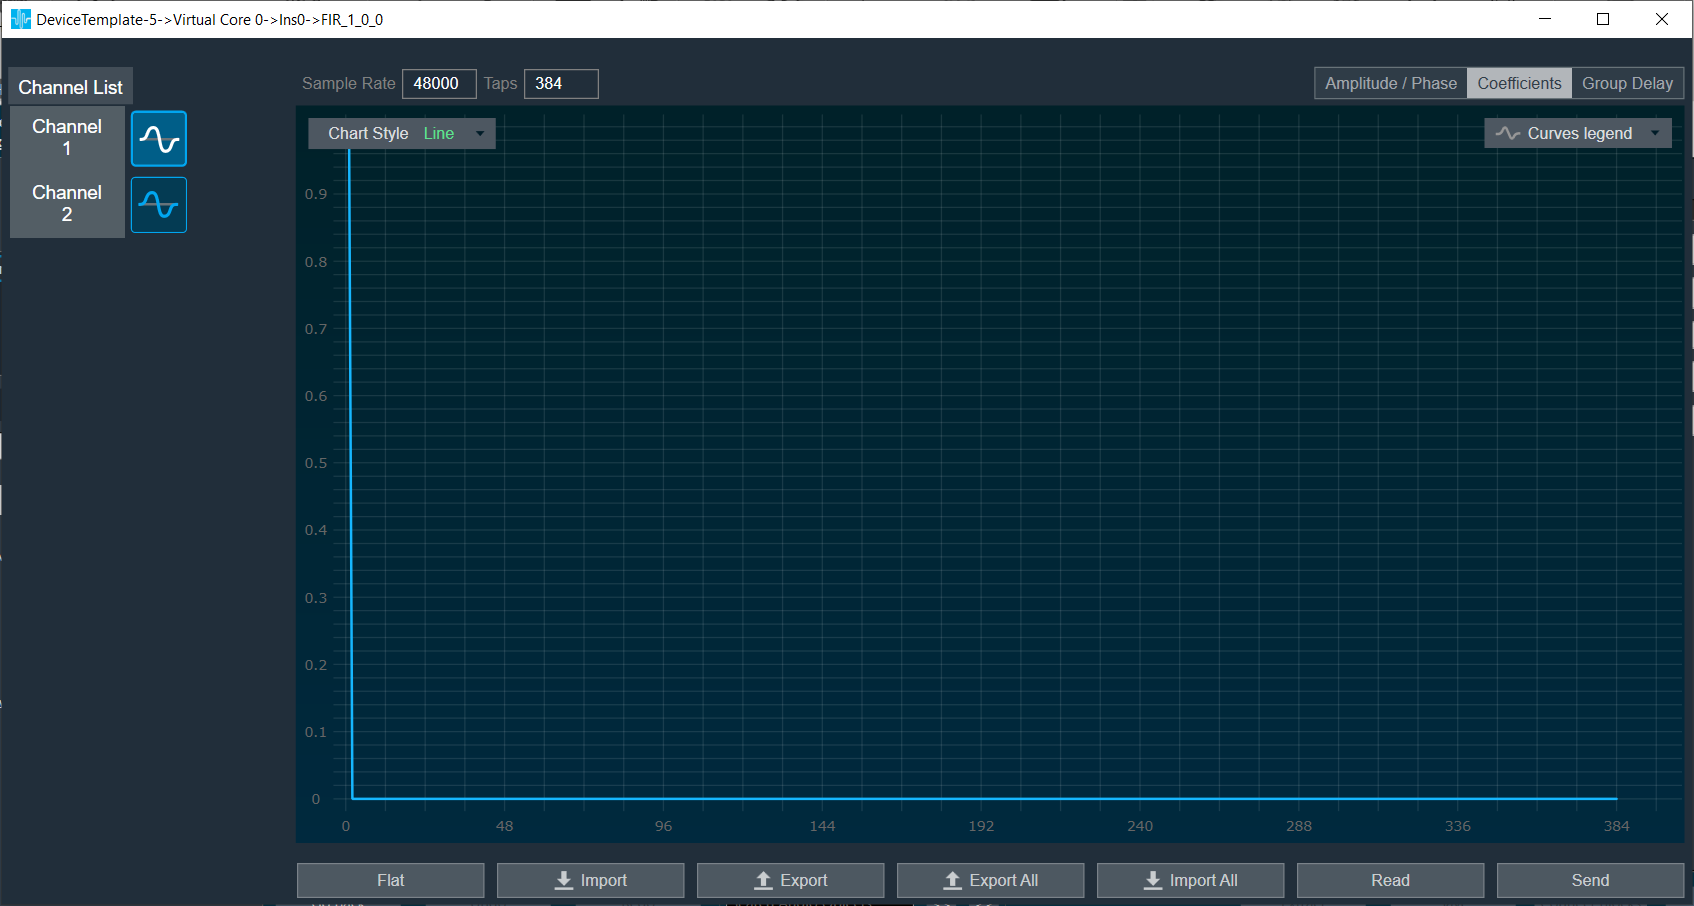
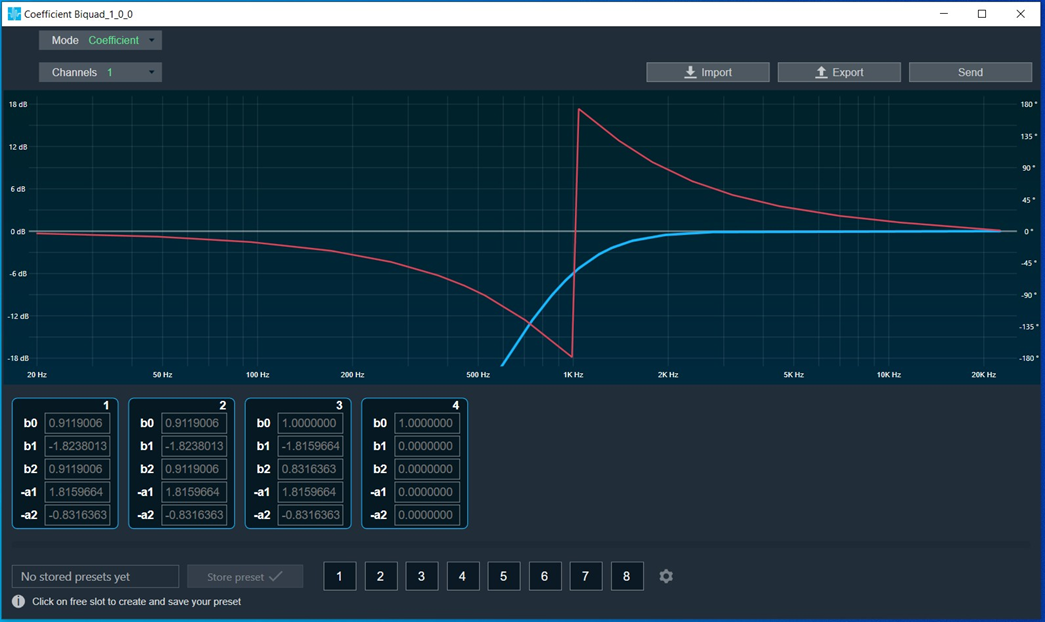
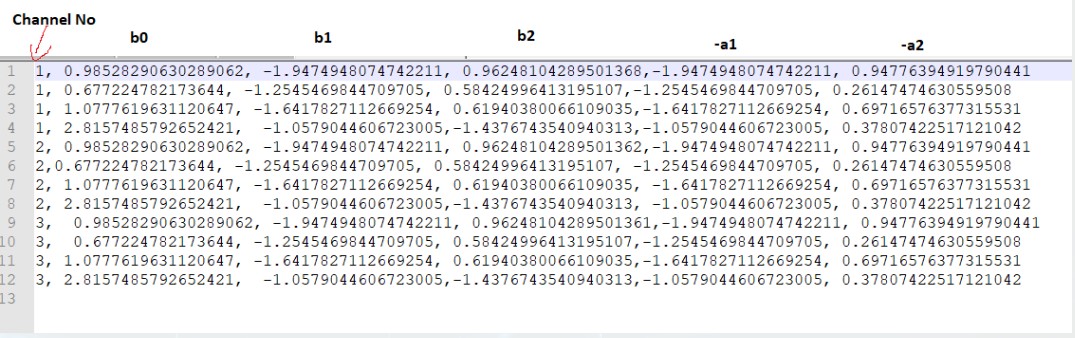
Coefficients: When the coefficients are given and the “Coefficients” option is selected, the graph displays the values as per below figure. You can change the graph style using the “Chart Style” option.
| Line chart style: when “Chart Style” selected as Line, the Coefficients graph. | 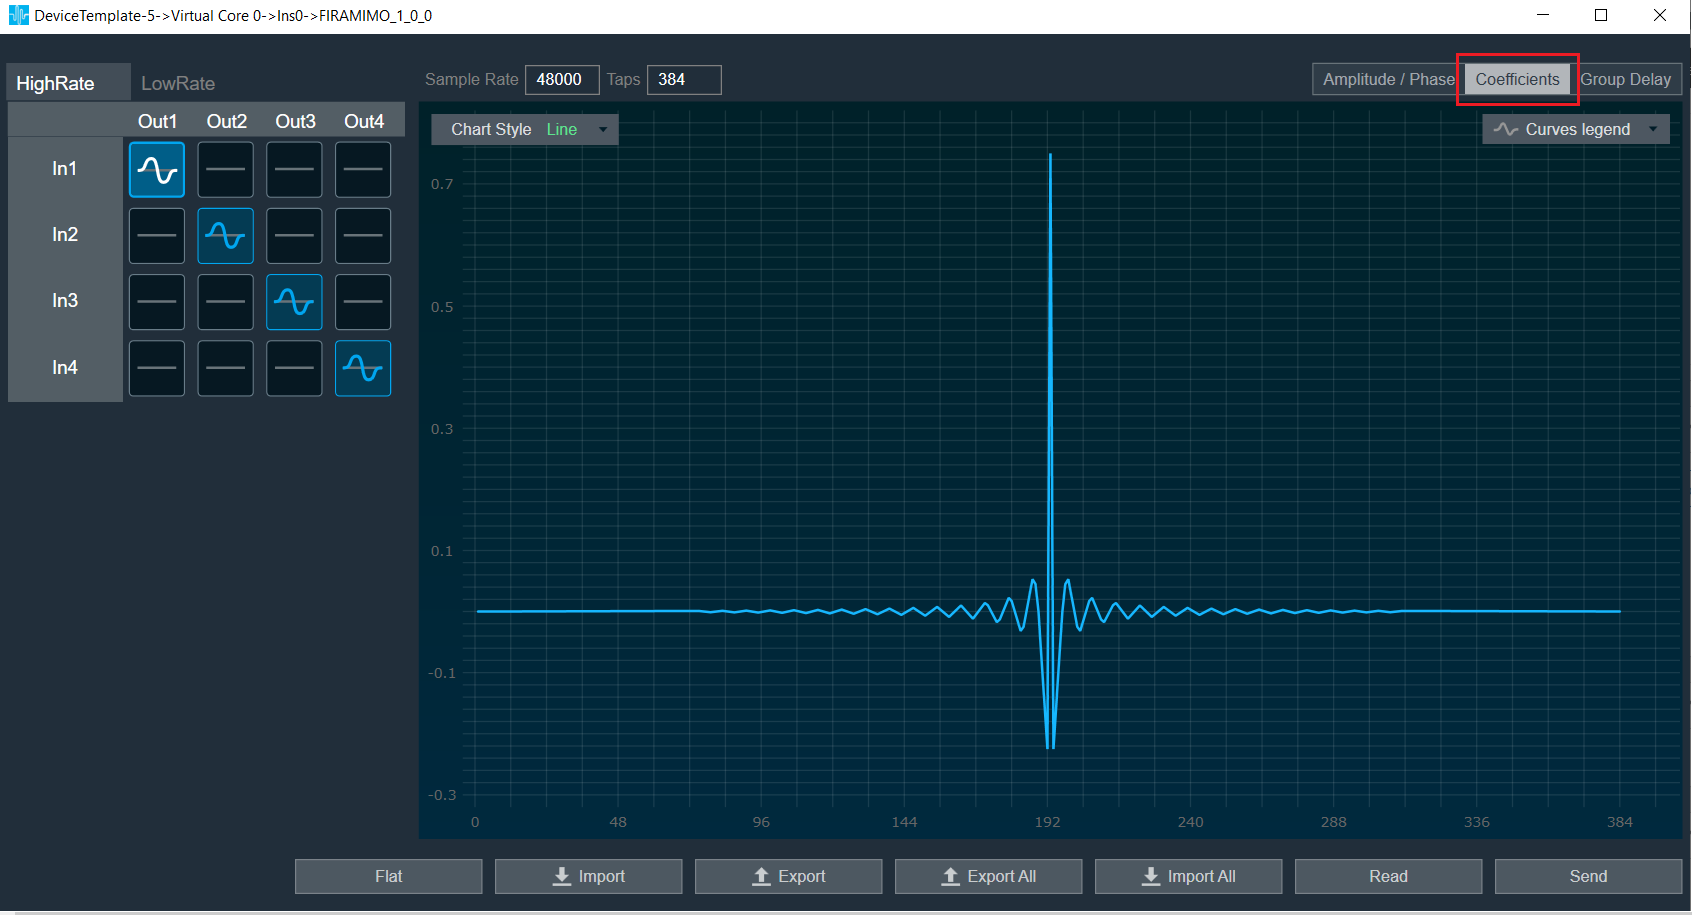 |
| Dot chart style: when “Chart Style” selected as Dot, the Coefficients graph. | 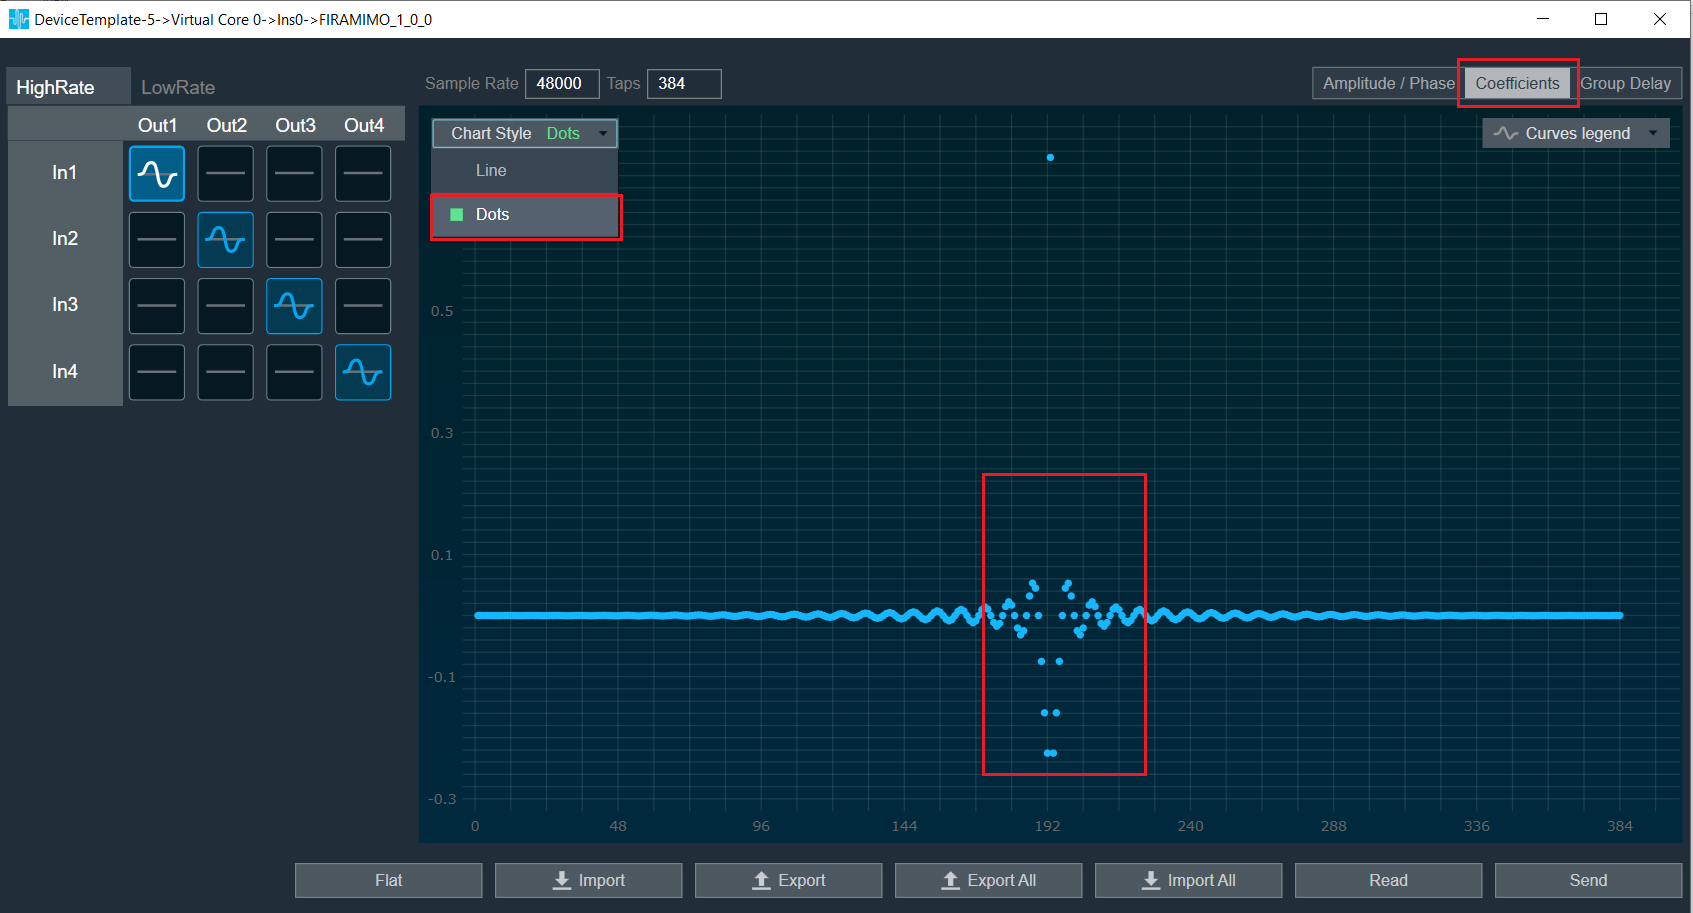 |
Group Delay: When the coefficients are given and “Group Delay” option is selected, the graph display the values.
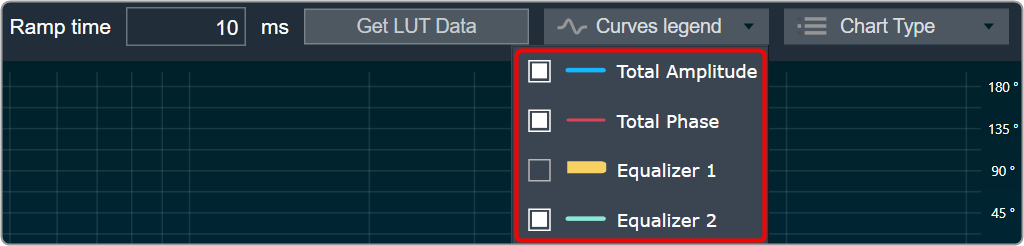
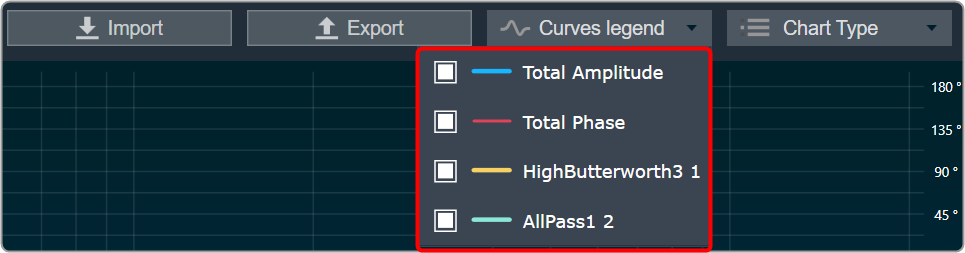
Curves Legend: This option allows you to show the details of which graph tab (Amplitude/Phase, Coefficients, Group Delay) is selected.
| On the selection of Amplitude/Phase graph tab Curves Legend will show below information. | 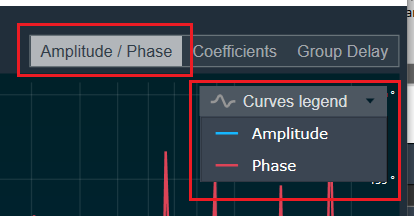 |
| On the selection of Coefficients graph tab and Chart Styles ‘Dots’, Curves Legend will show below information. | 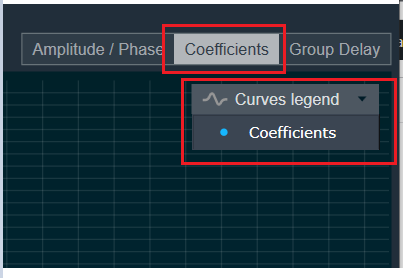 |
| On the selection of Coefficients graph tab and Chart Styles ‘Line’, Curves Legend will show information. | 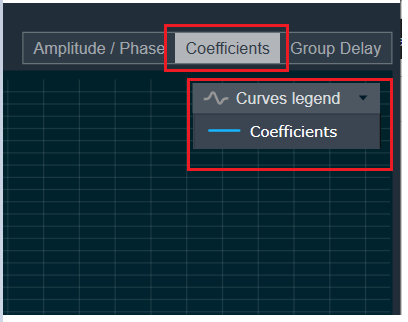 |
| On the selection of Group Delay graph tab, Curves Legend will show information. | 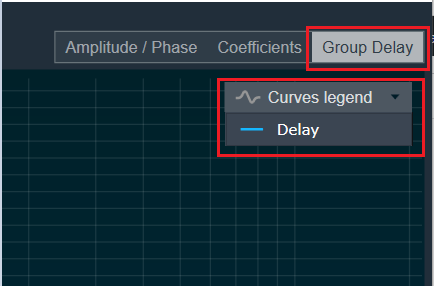 |
Additional Functionalities
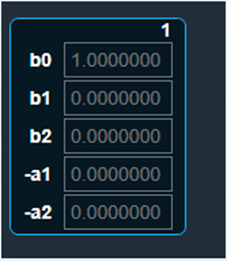
- Flat: This is used to make the graph flat by making coefficients to 0.
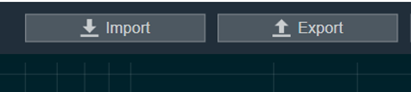
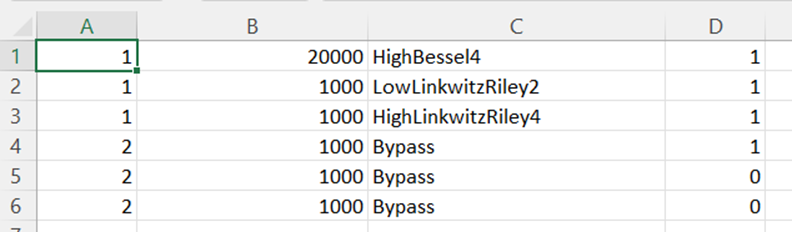
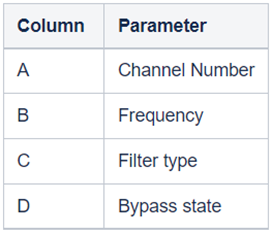
- Import: This function is used to import the coefficients for a single active filter. Click on the “Import” button, then enter the file path and click Ok.
All coefficients for the selected filter will be imported, as shown in the graph. If the number of coefficients does not match the number of taps, a warning pop up will appear. Click ‘Yes’ to import available coefficients or click ‘No’ to cancel the import. - Export: This option is used to export coefficients for selected active filter into csv file.
- Export All: This option is used to export all active filters in one go. Click on the “Export All” button, enter the path and file name, then click Ok. A xml file will be created which have coefficients for each active filter.
- Import All: This option is used to import all coefficients in one go. Click on the “Import All” button, enter the XML file path and then click Ok. All the given coefficients will be imported and can be seen in the graph.
- Read: This is used to read from the target to display in the panel.
- Send: This is used to send the values changed in panel to target.

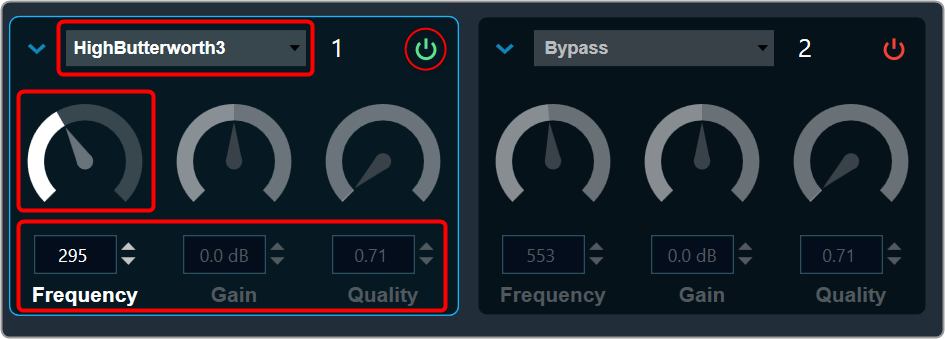
 Bypass button to enable or disable Bypass.
 you can change the value.


 Bypass button to enable or disable Bypass.
 you can change the value.

 you can change the value.