Traces

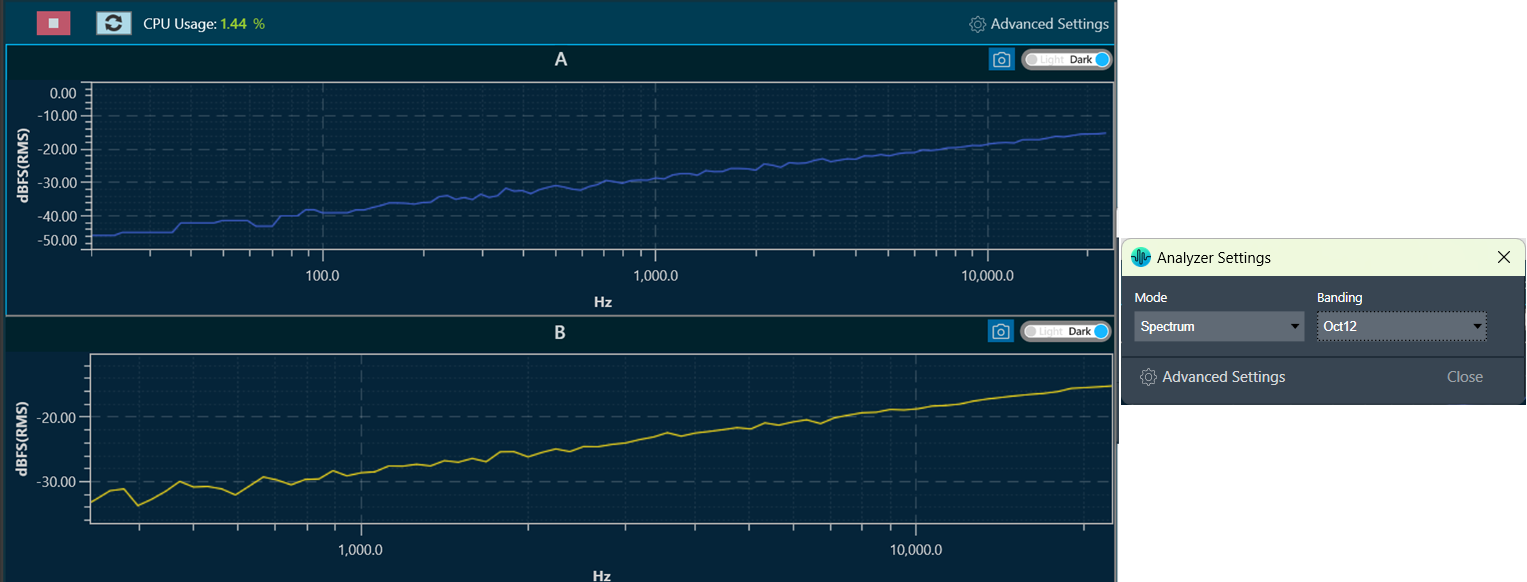
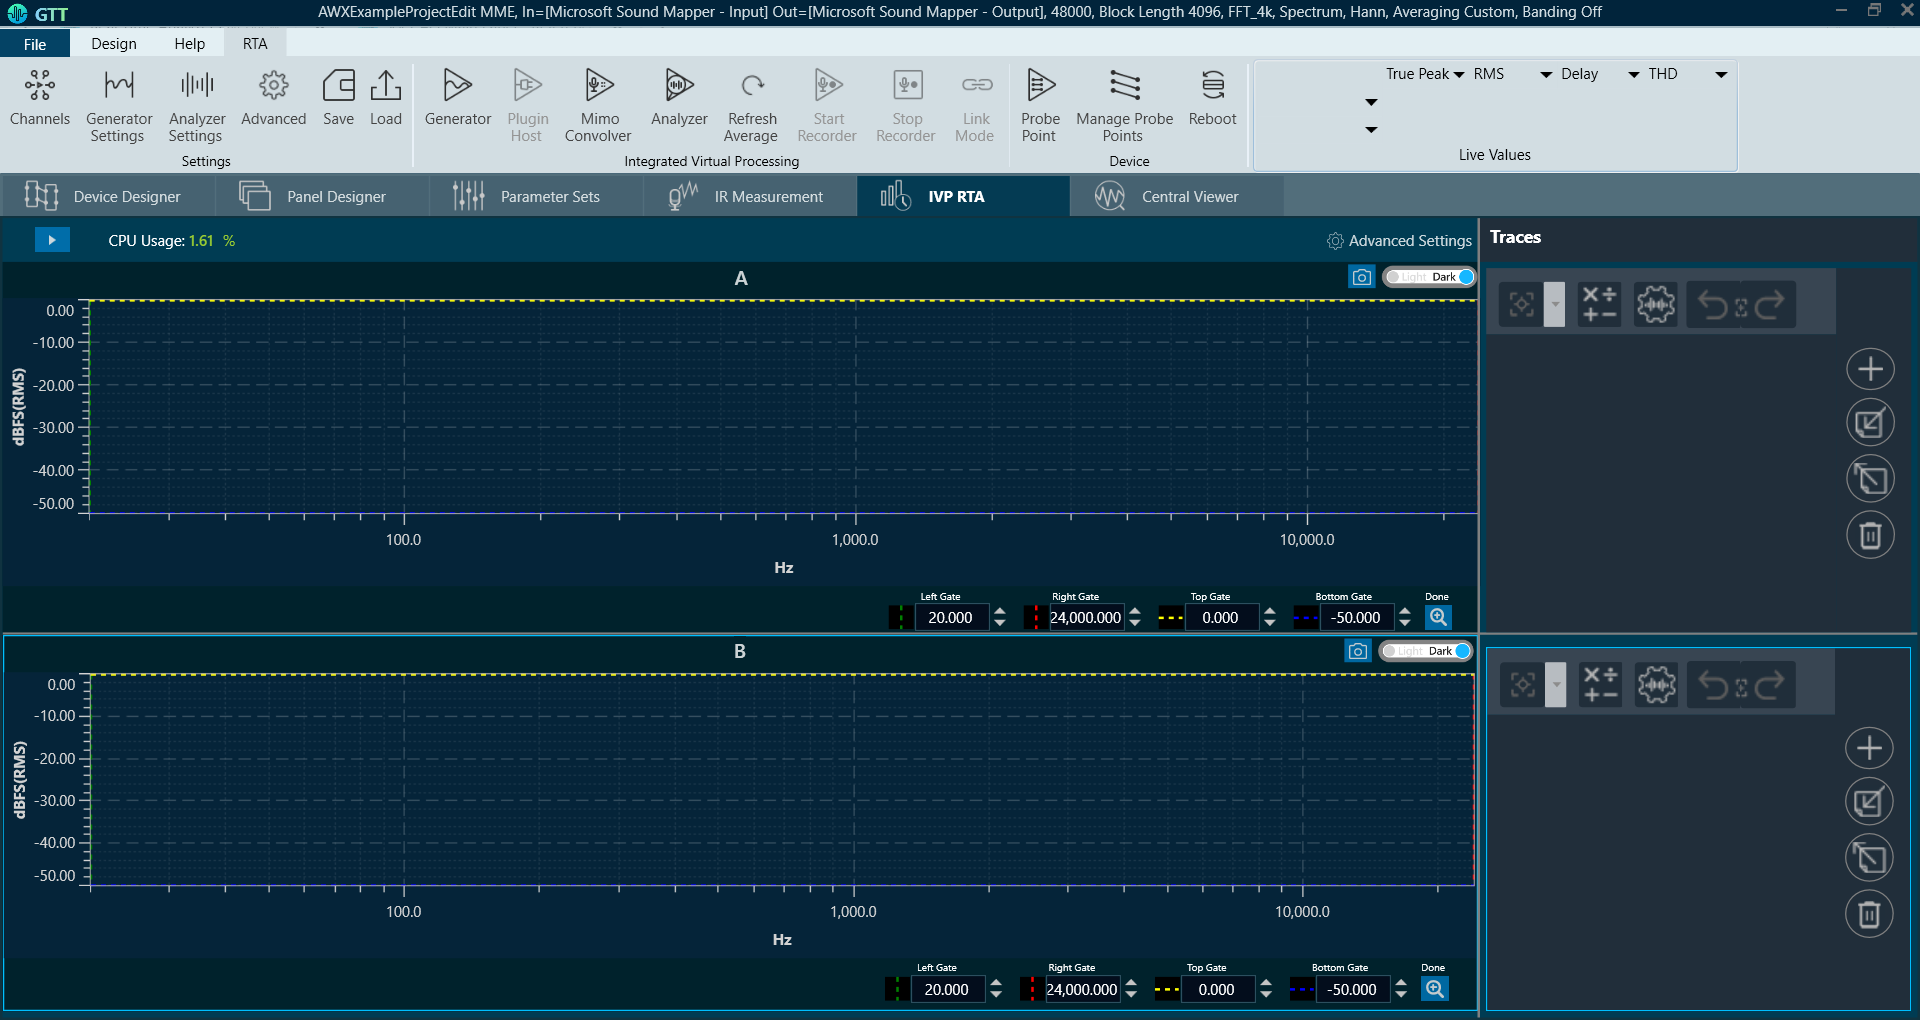
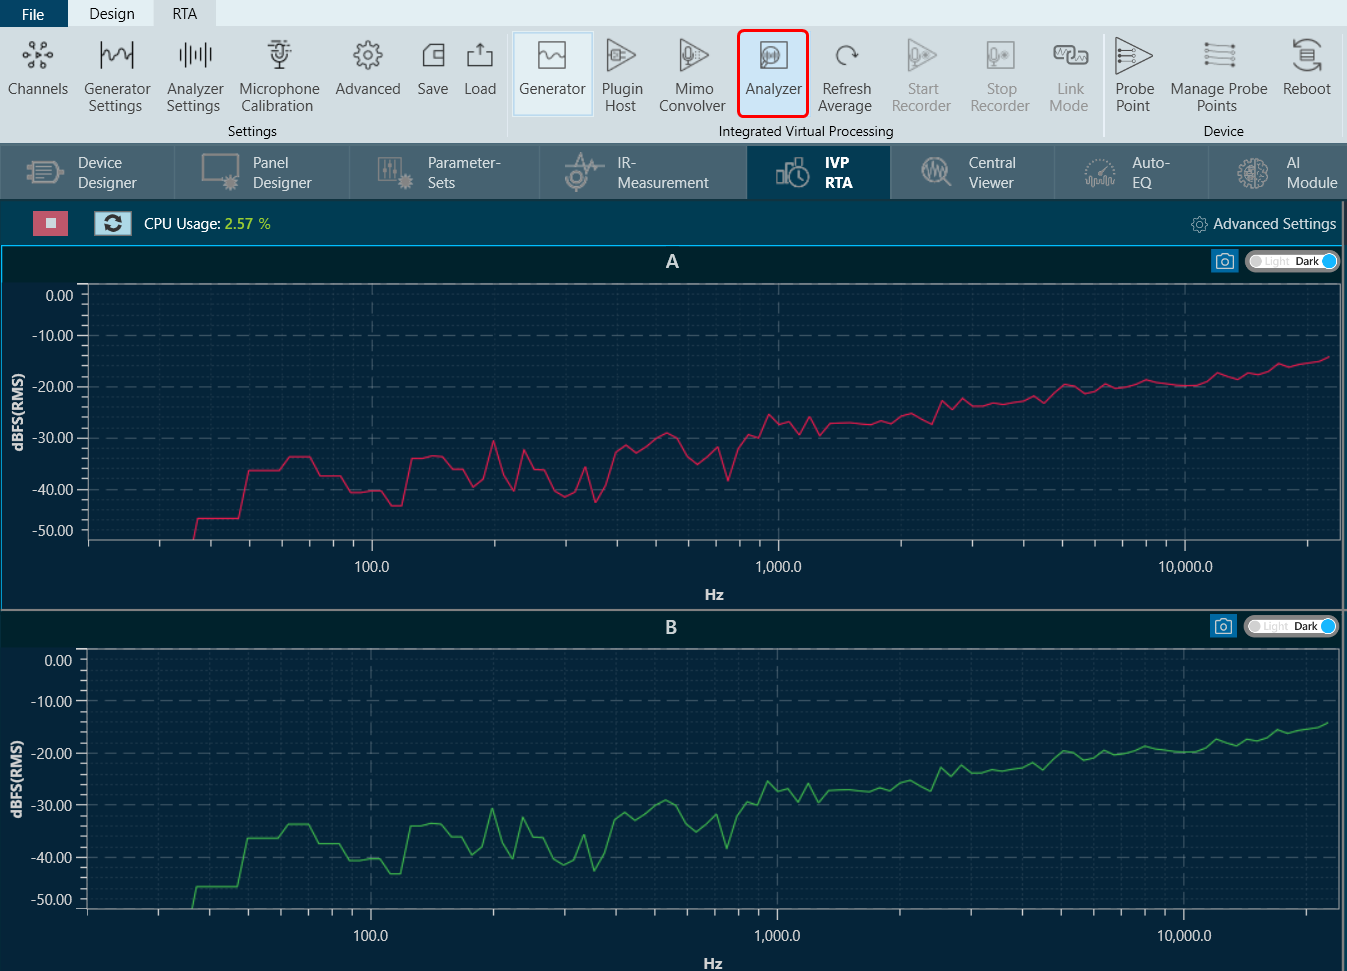
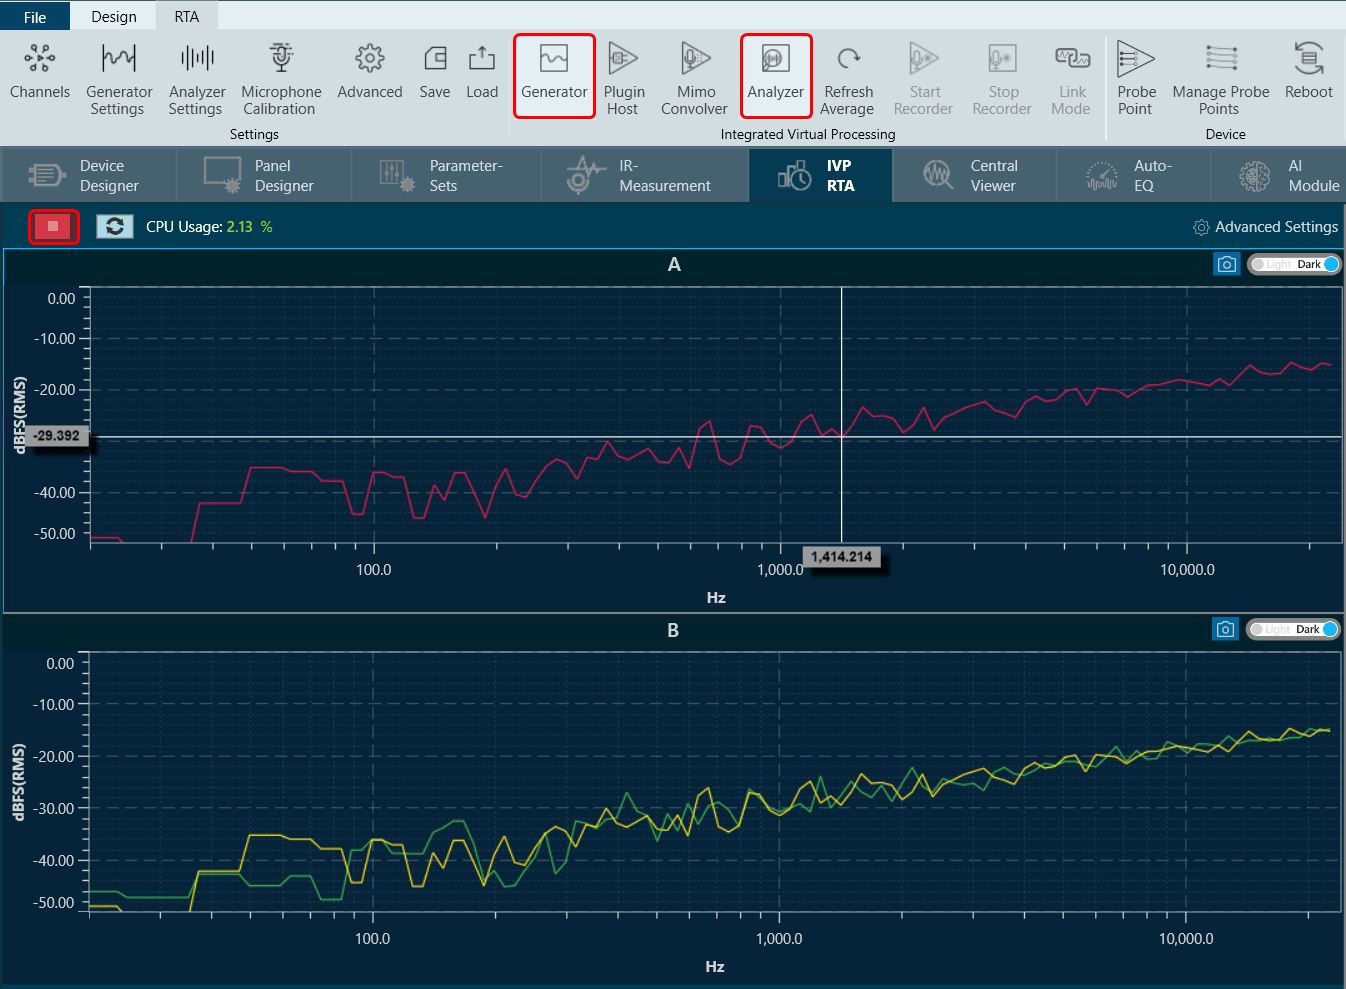
Traces allows you to display multiple captures of measurement curves on a single plot, allowing for quick and convenient comparisons of the measurements. The controls for traces are located on the right side of the spectrum graph.

A trace in RTA is a captured measurement curve.

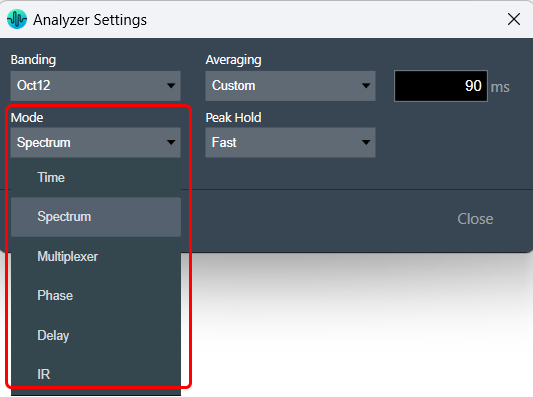
There are eight different kinds of traces:

  • Spectrum: Complete data set from measurement without phase.
  • Phase: Complete data set from measurement with phase data.
  • Txt: Data imported from a text file (tab separated frequency – spectrum value pairs per line)
  • Ovl: Data imported from an Overlay file format.
  • HATS: Data imported from HATS software exported text file.
  • Central Viewer: Data imported from Central Viewer exported Magnitude data text file.
  • Eq: Target curve, a spectrum curve described by biquad filter parameters.
  • Peak Hold: Peak hold trace with three-time constants.

Traces view is available only in Frequency Domain analyzer modes like Spectrum, Phase i.e. it is not available in Time Domain.

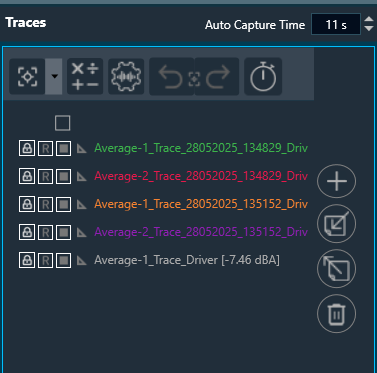
The trace menu is comprised of a trace toolbar and a trace list.

Each entry in the trace list includes a button for re-capturing, a checkbox for selection, and a trace label. The selection checkbox is used to designate the trace for mathematical operations.

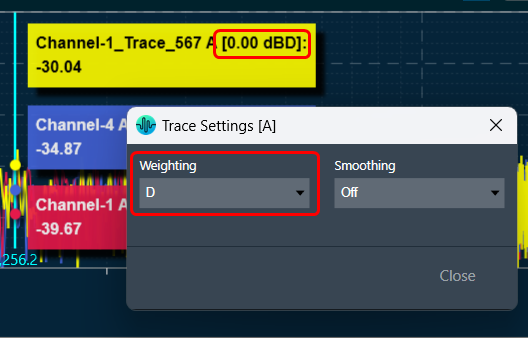
Double-click on the trace label opens the trace property dialogue.

In this dialog, you can set the name, offset, and color for each trace. You can view all SPL (ABC) values simultaneously, which will aid in final documentation purposes. Additionally, “Next” and “Back” buttons are provided, allowing you to navigate through multiple traces and make edits to them simultaneously.

If you select SPL Weighting in the trace settings, you can choose to display it on the trace list without affecting the graph or live value measurements.

Related Topics

Generator Settings

A signal generator is an important feature that generates specific measurement signals. These signals can be sent to the device or system for evaluation.
To conduct audio measurements, it is essential to have specific measurement signals that can be produced using a built-in signal generator. You can generate a signal using the “Generator” button in the ribbon bar.

By utilizing the “On/Off” function, you can activate or deactivate a signal. It is possible to generate multiple signals using this feature. The number of signals visible in the “Generator” window is determined by the number of instances specified in the Generator settings.

The gain of the generator signal can be adjusted in 1 dB steps with the Gain control.

To configure the signal, click on the “Generator Settings” to open the advanced RTA setting dialogue box. Here you can configure different generator modes.

On the RTA setting dialogue box, enter the instance value or use the increase and decrease buttons to change the instance value.

Using the “Mode” option, you can select different signals from the drop-down list. The available modes are listed below.
For more details about advance generator settings, refer to the Advance Generator Settings.


Microphone Calibration

Microphone setup tasks such as calibration, channel selection, and mic compensation file selection can be done using the Mic Setup view. If analyzer source is Sound-In, its respective calibration and compensation files will be considered for magnitude curve correction.

The compensation file is only considered for magnitude curve correction; it has no impact on calculated metrics such as sound pressure level (SPL) and total harmonic distortion (THD).

Analyzer Settings

Using an Analyzer, you can measure and analyze various aspects of an audio signal. It can be used to measure characteristics such as frequency response, amplitude, distortion, and noise level.

You can configure following features to measure and analyze various aspects of an audio signal.

  • Banding For breaking a signal into a number of different frequency bands, and encodes each one independently.
  • ModeFor selecting different analyzer modes.
  • Advance Settings – For configuring advanced analyzer settings, for more details refer to Advance Analyzer Settings

Banding


In Spectrum or Multiplexer mode, it is possible to adjust the “Banding”. When the banding is turned off, all frequency bins of the spectrum are displayed, allowing for a highly detailed analysis. However, this setting requires more CPU power as the amount of data that needs to be calculated and displayed increases with the FFT size.

Spectrum mode is shown in the example below when Banding is turned off.

On the other hand, when banding is turned “On”, frequency bins are grouped together. The width of each group can be adjusted by fractions of an octave, such as Oct12, which means that one band has the width of a 12th of one octave.

Spectrum mode is shown in the example below when Banding is turned on.

Mode


Using the Mode option, you can select different analyzer modes from the drop-down list. The available modes are listed below.

  • Time: Displays source channels in the time domain (one block of 4096 samples).
  • Spectrum: Displays the spectrum of the source channels.
  • Multiplexer: Switches the RTA into a multiplexer mode where multiple source channels are combined into two average channels.
  • Phase: Displays the magnitude and phase of the source channels. Phase can be wrapped and unwrapped using Graph Settings in the settings window. The phase measurement is done by a dual-channel FFT analysis.
  • Delay: Displays source channels in the time domain. The delay measurement is done by cross correlation between a reference channel and a channel that contains the reference signal that went through a certain path (example – amp – speaker – microphone). From the position of the maximum within the correlation result the delay can be calculated. The calculated Delay value is displayed in the Channel viewer in the Delay column.
  • IR: Displays the magnitude and IR of the source channels. This is an Impulse response measurement with an exponential sine sweep. When this analyzer mode is selected ‘ExpSweep’
  • Generator mode is set, and you are not allowed to change to other modes. The ‘Play’ button is disabled in the Generator view and with the ‘Single’ button he can generate ‘ExpSweep’ once.

Channels Settings

In the Channels setting window the numerical measurements are displayed for each channel.

The channel viewer list contains the following columns:

  • The first column indicates the color of the channel. This allows you to change the color of the channel by clicking on the color box.
  • Name: Display the name of the channel. You can change the name in the Analyzer Settings dialog box.
  • Offset: +/- Db shifting of measured and math operated channels.
  • Enable: Channel enable and disable allow on display graphs on Analyzer window.
  • Peak: The peak amplitude of the current block of analyzed audio samples.
  • Rms: The sound level meter value, the unit as set in the Analyzer Settings (dBFS, dBV, dBSPL) with selected Weighting (A B C D).
  • Thd: Total harmonic distortion in percentage (%).
  • Thd+N: Total harmonic distortion plus noise in percentage (%).
  • Delay: This value is calculated if Analyzer mode is set to ‘Delay’. The delay measurement is done by cross correlation between a reference channel and a channel that contains the reference signal that went through a certain path (example: amp – speaker – microphone). The delay can be calculated using the position of the maximum within the correlation result.
  • Peak Freq: The frequency of the maximum level in the measured spectrum in Hz.
  • Graph: Radio buttons allow you to quickly select the graph that displays that channel

By using the Peak, Rms, Thd, Thd+N, Delay, and Peak-Frequency buttons, you can select which values to display in the list.

In addition to assigning individual channels to specific graphs, you can also perform bulk assignments. If no channels are selected, you can use the “Move all channels to A, B, or Both” button to move all channels, including calculated channels, to the desired graph.

If one or more channels are selected, the same buttons will only move the selected channels to the desired graph.

You can use the “Select All” and “Select None” buttons to check or uncheck all channels, respectively.

The selector control located at the top left of the window enables you to choose which group of channels to display in the list: all channels (Graph A & B), only Graph A channels or only Graph B channels.

The channel window is designed to remain on top of other windows and can be resized as needed, making it easy to keep open for value observation while using the RTA.
Click on the “Advanced Settings” to perform additional configuration. For more details about Advanced configuration, refer to the RTA Advanced Settings.

Math operation on Live Channels

To perform math operations:

  1. Select any two channels.
  2. Click on the Calculate button to get the math operation result.
    Math operated channel is listed on the same view.

You can delete Math operated channel and as a tooltip, you can find which channels are selected for math operations.

Only one Math operated channel can be created for combinations of measured channels.

Overview

The Real Time Analyzer (RTA) is a multi-channel analyzer for audio signals. It provides time and frequency domain analysis tools to measure RMS or peak levels, frequencies, THD, delays, magnitude, and phase responses. A built-in signal generator provides sine tones, sweeps, and pulses and various noise signals. Using a file player recorded signals can be analyzed.

Related Topics

For more details about steps and configuration, you can refer video explaining Step-by-Step Real-Time Analyzer Walkthrough.

Settings

Below are the settings available for configuration in the Real-Time Analyzer.

When the RTA or Measurement Module is opened, the main window title bar is updated with status information including sound card and analyzer settings information such as

  • Selected HOST API
  • Selected device
  • Sample rate
  • Block length
  • FFT length
  • Analyzer mode
  • FFT window
  • Averaging
  • Banding

Integrated Virtual Process (IVP)

Integrated Virtual Process (IVP) refers to the use of virtualization technology to create a seamless and interconnected environment for analyzing various audio signal processes. It involves following operations.

  • Generating virtual signals
  • Connecting Plugin Host
  • Utilizing Mimo Convolver
  • Analyzing audio signal
  • Utilizing Probe Points

For more details, you can refer video explaining Integrated Virtual Process (IVP)/RTA process in Global Tuning Tool.

You can start Integrated Virtual Processing by clicking the “Analyzer” or Play button.

Integrated Virtual Processing is a combination of the following options.

  • Generator: Used to start/stop generator.
  • Plugin Host: Used to start/stop plugin host
  • Mimo Convolver: Used to start/ stop mimo convolver.
  • Analyzer: Used to start/ stop analyzer.
  • LinkMode:  The Link Mode feature allows you to establish a connection between the measurements in the upper and lower graphs on the RTA screen. This connection enables you to perform trace capture and other operations simultaneously on both graphs.

To enable Link Mode, you need to configure the Analyzer settings mode option to Average.

On clicking Link Mode, you will be presented with an option to provide the name of the charts from the below window. Once the linking is activated, any operation performed on the Traces in the upper graph will be reflected in the lower graph. The upper graph will refer to Average Channel 1 and the lower graph will refer to Average Channel 2.

Related Topics

Analysing Audio Signal

This section explains how to configure for basic measurement and analyse RTA without Soundcard Signal.

Configure Basic Measurement

Steps to configure basic measurement for analyzing audio signal.

  1. On the IVP RTA tab, click on the Advanced or Advanced Settings. This opens RTA Settings window.

  2. On the RTA Setting window, select the Sound Card tab, and then select the “Sound In device” that is connected to a microphone for channel 1 + 2.
  3. Switch to the Analyzer tab, click on the Source for Channel-1, and select SoundIn1 from the context menu.
  4. When you have finished configuration, click Done to close the Setting dialogue box.
  5. On the ribbon bar, click on Analyzer. The RTA graph now displays the incoming microphone signal in the time domain.
  6. In order to display the spectrum of the signal, click on the Analyzer Settings in the ribbon bar. This opens the Analyzer Setting window.
  7. On the Analyzer Settings window, set the Mode to Spectrum from the drop-down list.

The graph now displays the spectrum of the incoming microphone signal.

As only one channel is active, the lower graph has been minimized by dragging the middle line and placing it at the bottom of the window.

Analyse RTA without Soundcard Signal

In order to test RTA without a soundcard signal, the test signal generator can be connected directly to the analyzer.

  1. On the Analyzer Settings window, click on Advanced Settings. This opens RTA Settings window.
  2. On Analyzer tab, click on the “Source” for Channel-1, and select Generator 1 from the context menu.
    A screenshot of a computer Description automatically generated with medium confidence
  3. When you have finished configuration, click Done to close the Setting dialogue box.
  4. On the ribbon bar, click on Generator, and click on Analyzer or “Play” button. The RTA graph now displays the spectrum of a 1 kHz sine signal.